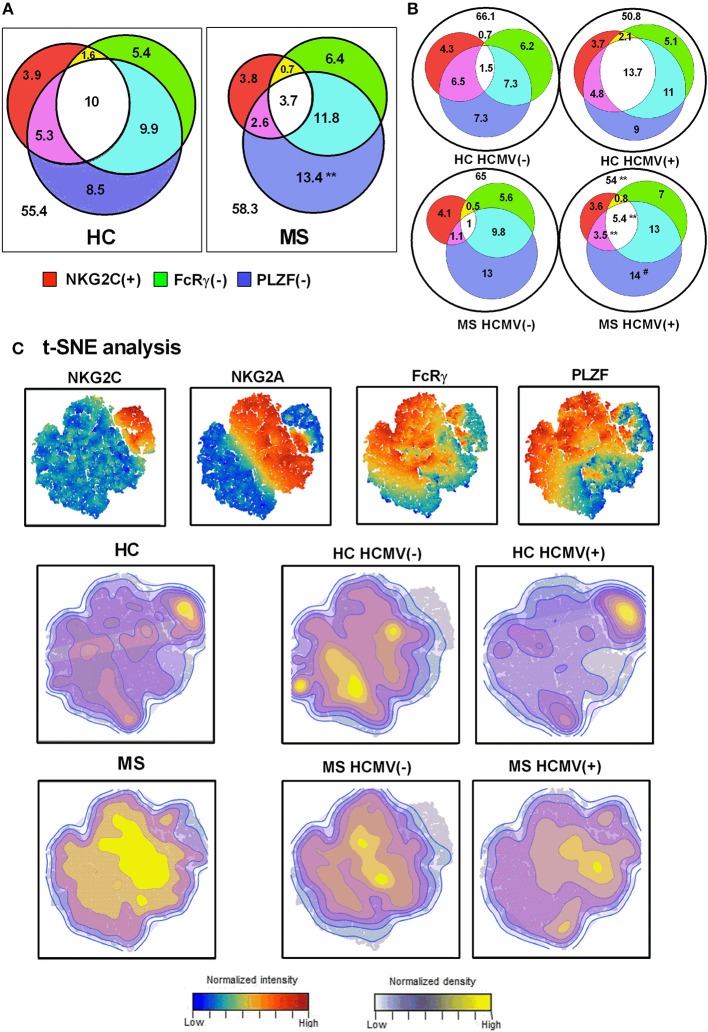
Figure 3.
Interrelationship of adaptive NK cell markers in MS. Venn diagrams depicting the proportions of NKG2C(+), FcRγ(–), and PLZF(–) CD56dim NK cells in healthy controls (HC) (n = 26) and MS patients (n = 86) (A), and stratifying results according to HCMV serostatus (B). Values expressed the mean proportion for each group. P-values (Mann–Whitney U-test): ** <0.01, comparing controls vs. MS patients; ## <0.01, comparing HCMV(–) vs. HCMV(+). (C) t-SNE plots of NKG2C, NKG2A, FcRγ, and PLZF expression in CD56dim NK cells evaluated in HC and MS patients according to HCMV serostatus.

