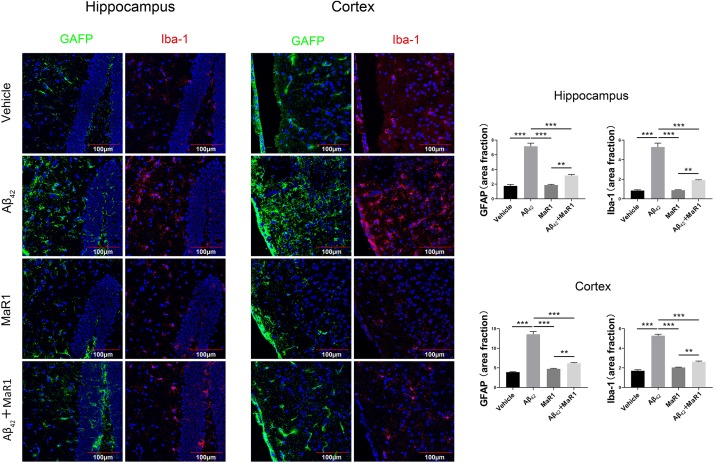
FIGURE 3.
Immunohistochemical staining for microglia and astrocytes in the hippocampus and cortex of AD mouse model. Micrographs and quantification of Iba-1and GFAP positive cells in hippocampus and cortex of the four groups (bar = 100 μm). The percentage of Iba-1 and GFAP positive in Aβ42 group was higher than that in Vehicle group, and these changes were attenuated by Aβ42 + MaR1 treatment (P < 0.001). Data are expressed by mean ± SEM, 10 mice in each group, and statistical significance is defined as follows: ∗∗P < 0.01, ∗∗∗P < 0.001.

