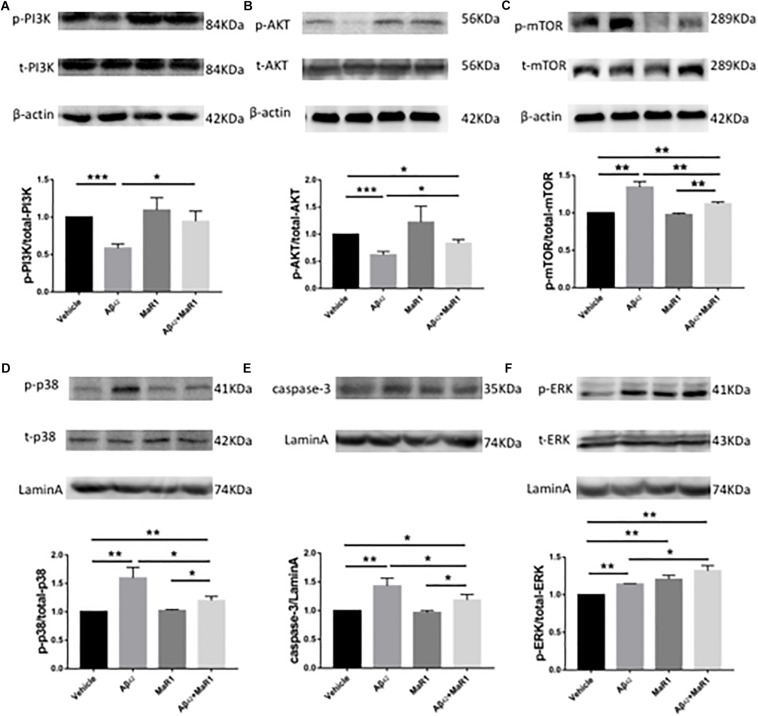
FIGURE 5.
MaR1 altered survival, autophagy, apoptosis, and MAPK signal pathways. Western blots for different proteins and its quantitation in the four groups, PI3K (A), AKT (B), mTOR (C), p38 (D), caspase 3 (E), ERK (F). Compared with Vehicle group, the ratio of p-PI3K/t-PI3K and p-AKT/t-AKT were down-regulated (A,B), while the ratio of p-mTOR/t-mTOR, p-p38/t-p38, as well as the levels of caspase 3 were up-regulated in Aβ42 group (P < 0.01) (C–E), however, these Aβ42 induced changes were reversed by Aβ42 + MaR1 treatment. (F) The ratio of p-ERK/t-ERK was increased by both, Aβ42 (P < 0.001) and MaR1 (P < 0.01) alone, and was further increased by their co-stimulation compared to Vehicle group (P < 0.01) and compared to Aβ42 group (P < 0.05). Data are expressed as mean ± SEM, 10 mice in each group, and statistical significance is defined as follows: ∗P < 0.05, ∗∗P < 0.01, ∗∗∗P < 0.001.

