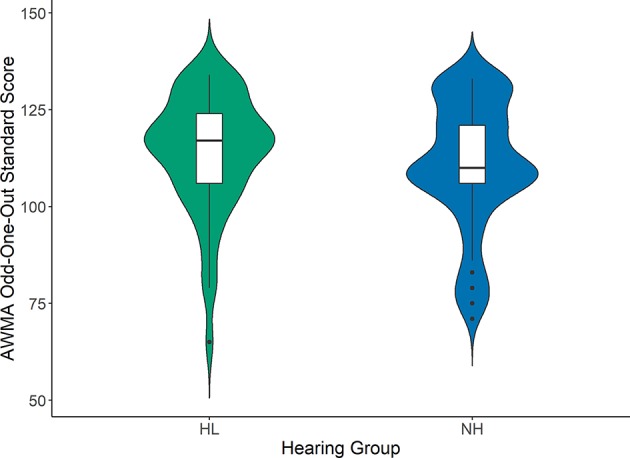
Figure 3.

Automated Working Memory Assessment Odd-One-Out subtest standard scores for children with hearing loss (HL; green) and children with normal hearing (NH; blue). Box plots represent the median (middle line) and interquartile range of the data. The colored regions around each box blot are symmetrical representations of the distribution of data points in each condition.
