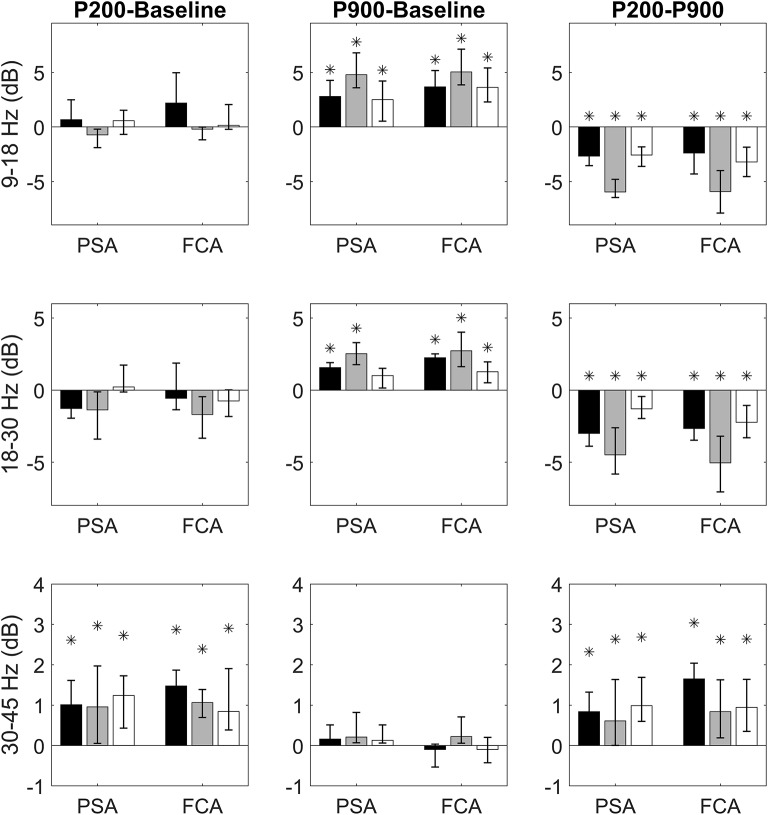
Figure 2.
Bandwise comparisons between couples of epochs are presented for PSAs and FCAs. Each bar represent the band-wise difference of spectral powers between P200 and Baseline (first column), P900 and Baseline (second column), and P200 and Baseline (third column). The bar color identifies the sensory modality: acoustic (black), tactile (gray), and visual (white). Comparisons in sigma (9–18 Hz), beta (15–30 Hz), and gamma (30–45 Hz) bands are presented, respectively in the first, second, and third row. Each comparison is performed for two regions of interest: Primary Sensory Area (PSA) and Fronto-Central Area (FCA). The PSA bars are related to only the electrodes of specific sensory modality (black PSA bars for acoustic PSA, gray PSA bars for tactile PSA, and white PSA bars for visual PSA). Data are expressed as median values and interquartile ranges. Significant (pairwise Wilcoxon signed rank test, p < 0.05) comparisons are highlighted by asterisks.

