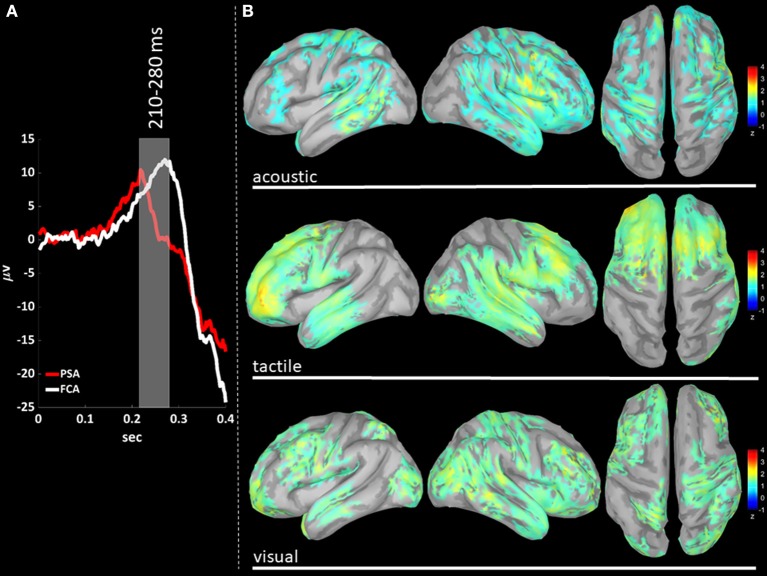
Figure 4.
(A) The time-courses of grand mean eKCs templates (averaged over sensory modalities) from the stimulus delivery to 0.4 s after the stimulus are presented for Primary Sensory Areas (PSAs, red line) and for Fronto-Central Areas (FCA, white line). The T210 time window (+210 to +280 ms) is identified by a gray panel. (B) Standardized cortical current densities of gamma (30–45 Hz) signals evaluated over the T210 time-window for acoustic (first row), tactile (second row), and visual (third row) sensory modalities. The standardized current densities are expressed as the mean z-scores averaged over the T210 with respect to the corresponding Baseline (see Figure 1). For each sensory modality, only cortical areas composed of at least 100 adjacent significant voxels were retained.

