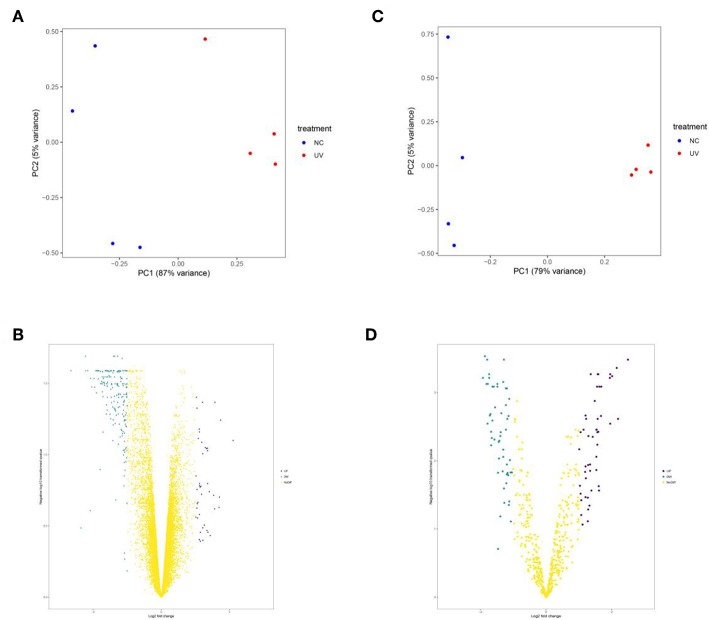
Figure 2.
The principal component analysis (A,C) and volcano plots (B,D) of mRNA and miRNA datasets, respectively. In (A,C), blue point represents sample in control group and the red one represents sample in UVR group. In (B,D), the blue point represents down-regulated genes, the purple point represents up-regulated genes and the yellow one represents genes with insignificant change.

