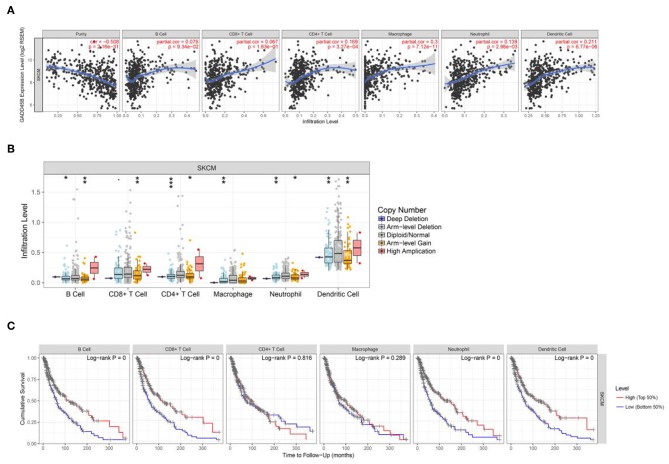
Figure 7.
The interaction of immune cell infiltration and specific factors. (A,B) The correlation of expression level vs. immune infiltration and copy number vs. immune infiltration using two-sided Wilcoxon rank sum test. The analysis contain B cell, CD8+ T cell, CD4+ T cell, macrophage, neutrophil and dendritic cell. (C) Visual survival differences of various immune cells (B cell, CD8+ T cell, CD4+ T cell, macrophage, neutrophil, and dendritic cell) in melanoma. The split percentage of patients is from 5 to 50%; the survival time interval is from 0 to 200 months. The red line represents high level and the blue line represent low level.

