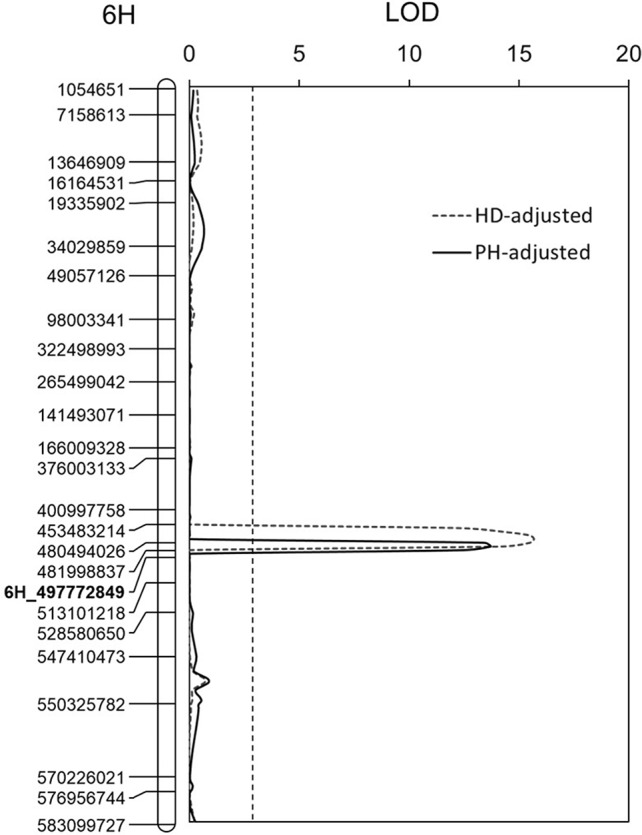
Figure 3.

Effects of plant height (PH) and heading date (HD) on Qcrs.caf-6H. Physical position for each of the markers is shown to the left of the linkage map, and distances in cM are shown to the right. The LOD values were obtained from the BLUP and postadjustment by HD and PH. The vertical dotted lines indicate the average significance threshold (LOD = 2.7) based on a test of 1,000 permutations. The SSR marker used in validating the QTL is in bold.
