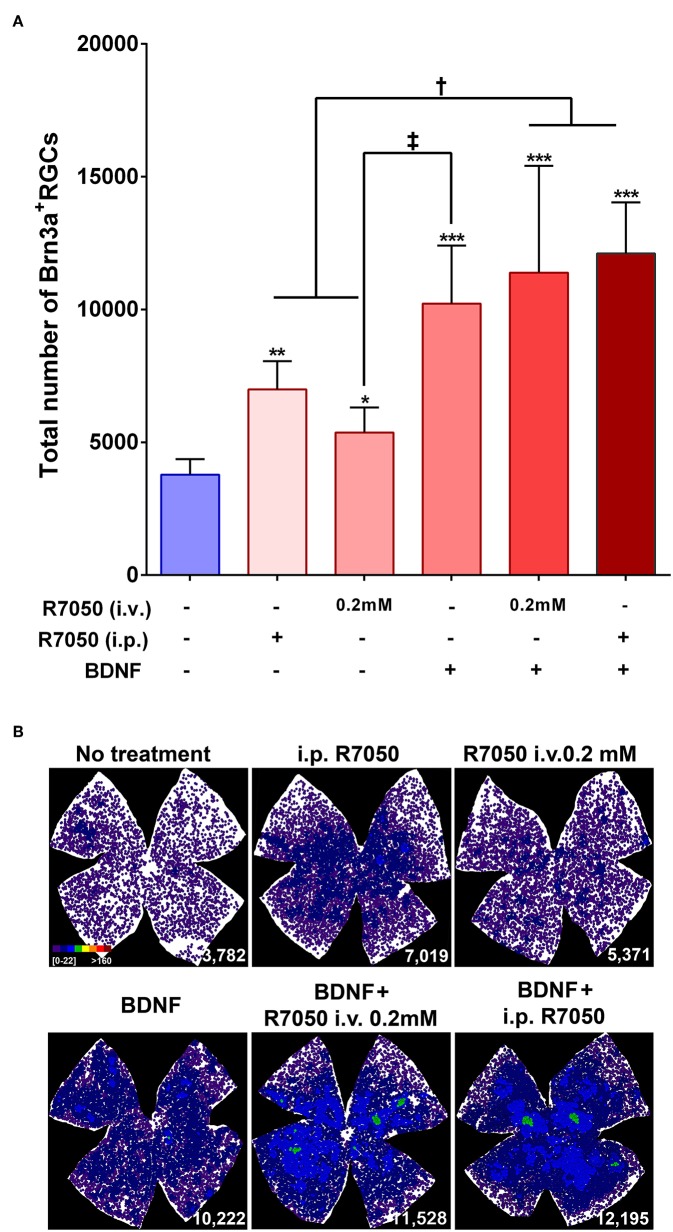
Figure 4.
Systemic and intravitreal treatment with R7050 alone or in combination with BDNF rescues RGCs during the slow phase of death after optic nerve axotomy. (A) Column bar graph showing the total mean number ± standard deviation of RGCs quantified in the different animal groups analyzed 14 days after ONC. *Statistically different from ONC alone (*p < 0.05; **p < 0.01; ***p < 0.001). †p < 0.01; ‡p < 0.05 (ANOVA, Kruskal-Wallis. Dunn's post-hoc test). See Table 1 for more details. (B) Neighbor maps showing the distribution of RGCs in a representative retina from each group and treatment. These maps illustrate the number of RGCs around a given RGC in a radius of 0.220 mm with a color scale (top left panel) from 0 to 22 neighbors (purple) to >160 neighbors (dark red). At the bottom left of each map is shown the number of RGCs counted in the original retina.

