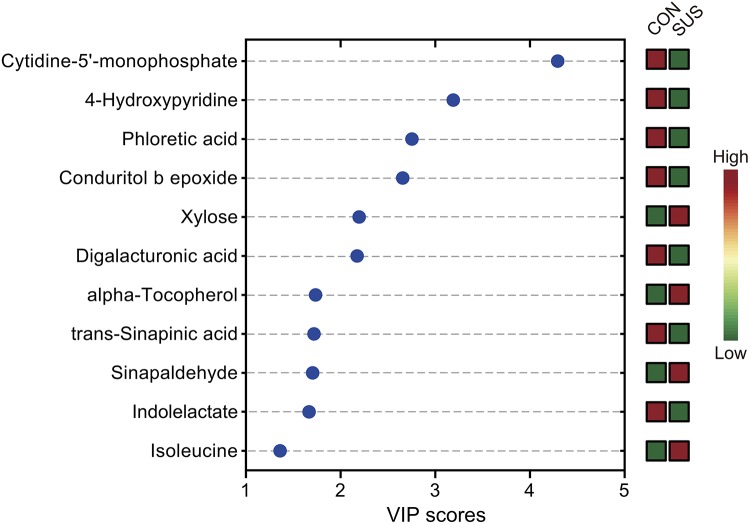
FIGURE 3.
Significantly different metabolites identified by partial least squares discriminant analysis (PLS-DA). The colored boxes on the right indicate the relative concentrations of the corresponding metabolites in cecal contents from the CON and SUS groups. VIP: variable importance in projection.

