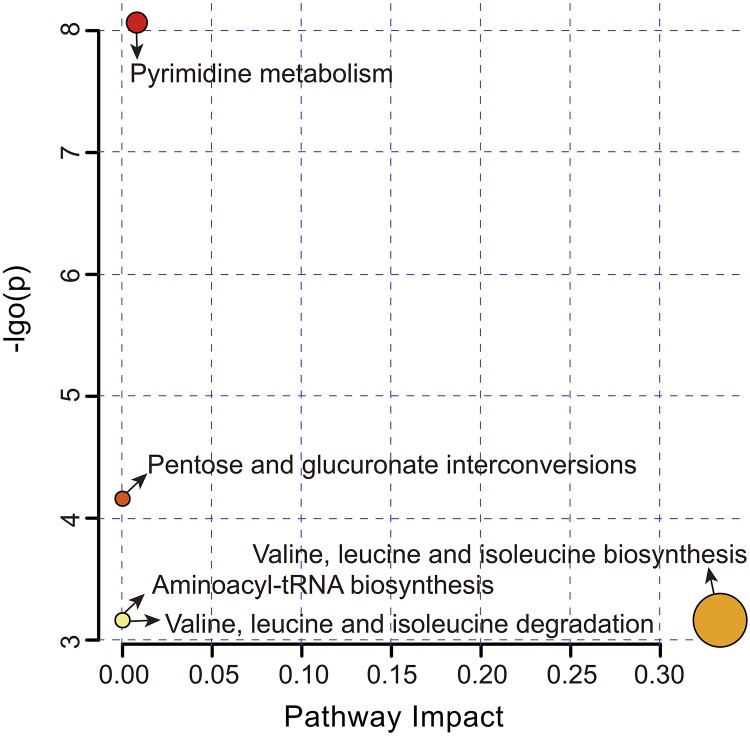
FIGURE 4.
Metabolome view map of the significantly different metabolites-related metabolic pathways in the CON and SUS groups. The pathway impact in topology analysis (x-axis) and P-value in enrichment analysis (y-axis) are presented. The size and color of each circle represent the pathway impact value and P-value, respectively.

