
FIGURE 5.
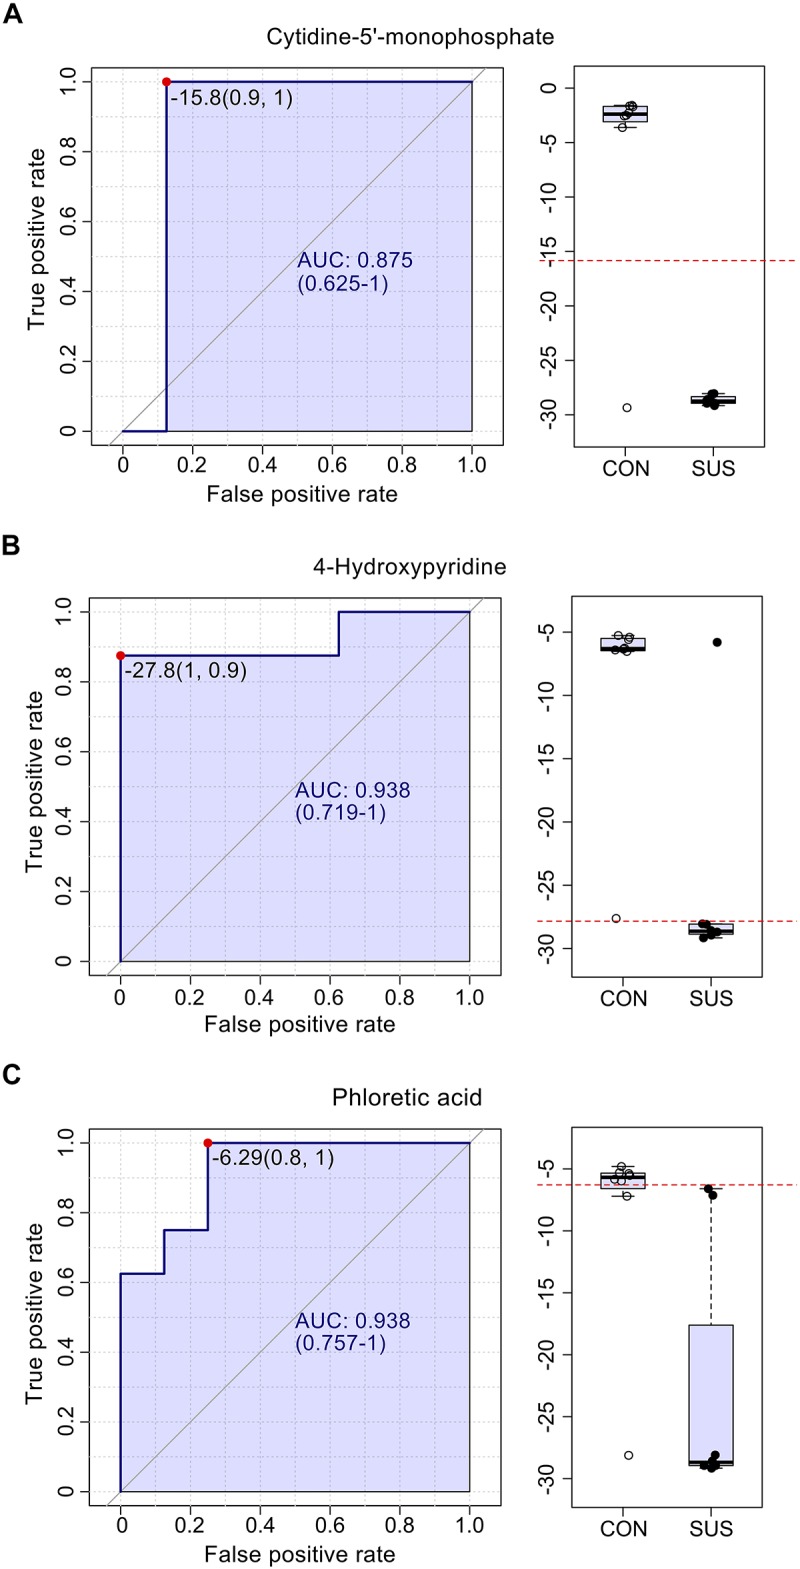
The ROC curves for cytidine-5′-monophosphate (A), 4-hydroxypyridine (B) and phloretic acid (C) with AUC and respective univariate performance (box plot) in the CON and SUS groups. ROC: receiver operating characteristic; AUC: area under ROC curve.