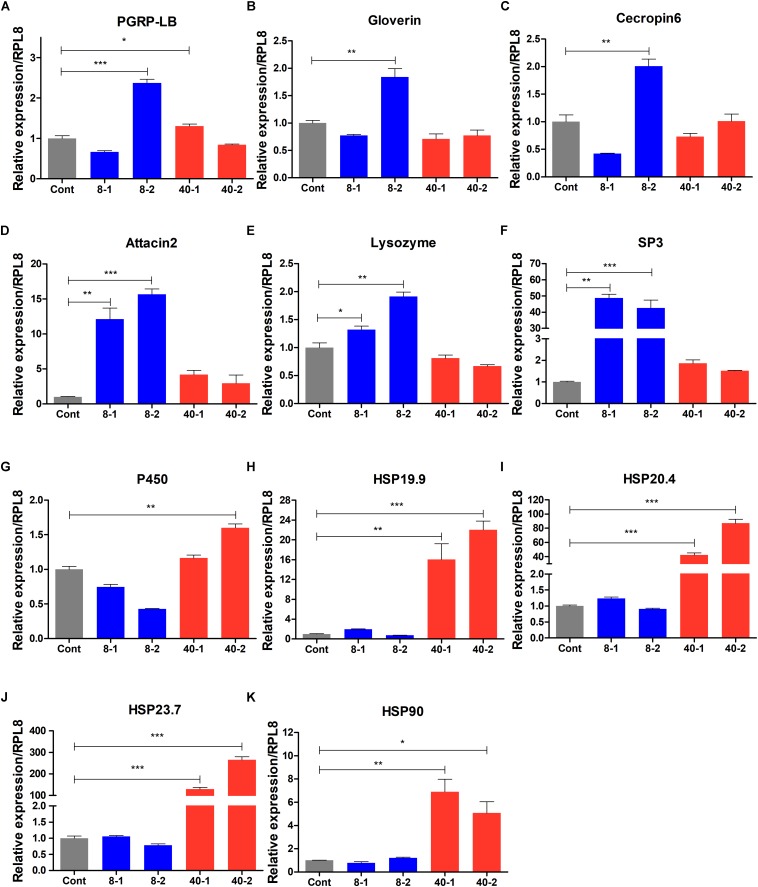
FIGURE 6.
Expression profile of stress- and immune response related genes in the temperature stressed O. furnacalis. The relative expressions of PGRP-LB (A), Gloverin (B), Cecropin6 (C), Attacin2 (D), Lysozyme (E), SP3 (F), P450 (G), HSP19.9 (H), HSP20.4 (I), HSP23.7 (J), and HSP90 (K). SP3: serine protease 3; Cont: control group reared under 25°C; 8_1 and 8_2: The differentially expressed transcripts in the low temperature (8°C) treated group 1 and 2 h posttreatment; 40_1 and 40_2: The differentially expressed transcripts in the high temperature (40°C) treated group 1 and 2 h posttreatment; Asterisks indicate significant differences: ∗p < 0.05; ∗∗p < 0.01; ∗∗∗p < 0.001 for pairwise comparisons by Student’s t-test.

