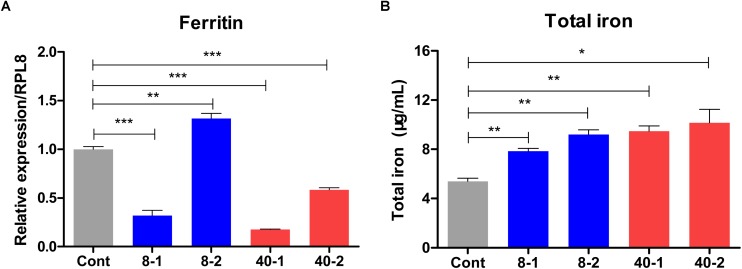
FIGURE 7.
Expression profile of Ferritin gene and the change of total hemolymph iron concentration in the temperature stressed O. furnacalis. (A) The relative expression of Ferritin. (B) Total iron concentration changes in response to temperature stress. O. furnacalis larvae were reared under 8 or 40°C, and the hemolymph was collected for iron concentration determination. Cont: control group reared under 25°C; 8_1 and 8_2: The low temperature (8°C) treated group 1 and 2 h posttreatment; 40_1 and 40_2: The high temperature (40°C) treated group 1 and 2 h posttreatment. Asterisks indicate significant differences: ∗p < 0.05; ∗∗p < 0.01; ∗∗∗p < 0.001 for pairwise comparisons by Student’s t-test.

