Figure 3.
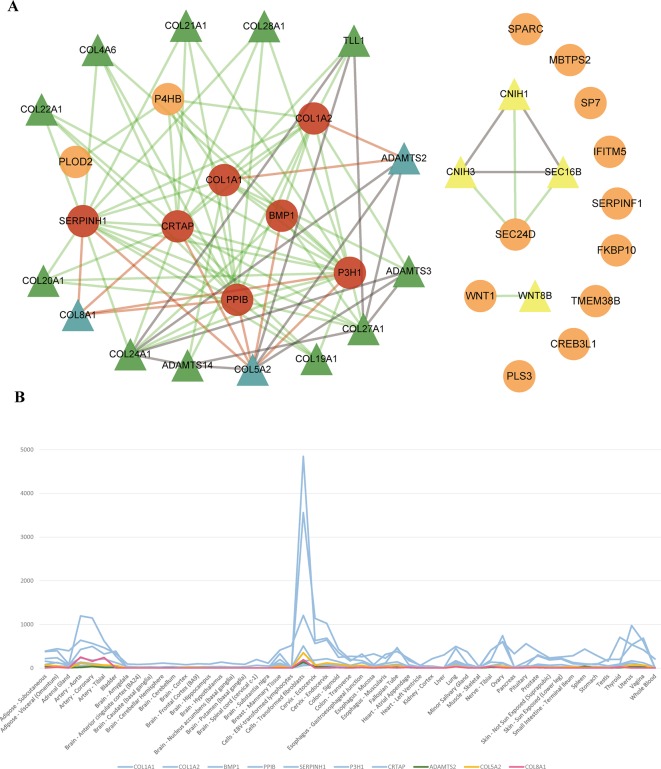
(A) Network of OI pathogenic genes and candidate genes. 93 interactions between 20 OI pathogenic genes and 18 interacted genes. The circles and triangles represent 20 OI pathogenic genes and 18 interacted genes (≥1 interaction), respectively. Yellow triangles denote four predicted genes (= 1 interaction). Green and blue triangles totally denote 14 predicted genes (the predicted gene set A) (≥2 interactions), and blue triangles denote three candidate genes (gene expression is consistent with OI pathogenic genes), respectively. Red circles denote seven OI pathogenic genes (interact with three candidate genes). Grey lines denote 15 interactions between predicted genes. Green lines and red lines totally denote 78 interactions between OI pathogenic genes and predicted genes, and red lines denote 11 interactions between three candidate genes and seven interacted OI pathogenic genes, respectively. (B) The tissue expression distribution of predicted genes and their interacted pathogenic genes. The green, yellow, red, and blue lines denote candidate gene ADAMTS2, COL5A2, COL8A1 and interacted pathogenic genes (COL1A1, COL1A2, BMP1, PPIB, SERPINH1, P3H1, CRTAP). All these genes are expressed highly in “Cells_Transformed_fibroblasts” and have a similar expression distribution among all human tissues.

