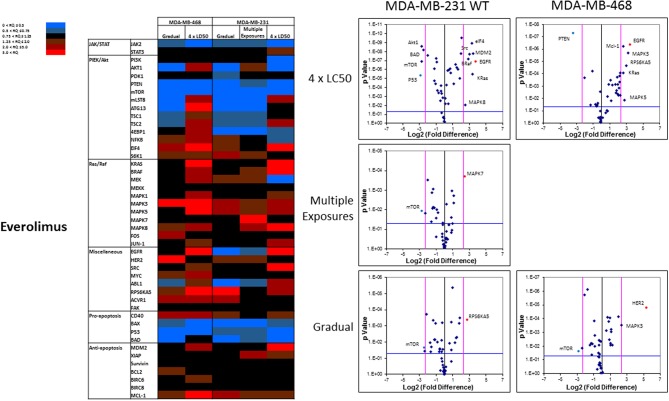
Figure 10.
Analysis of mRNA expression level of selected proteins in resistant vs. naïve cell populations: Proteins were selected in different categories (involved in JAK/STAT, PI3K/Akt, Ras/Raf pathways, as well as pro-apoptosis, and anti-apoptosis proteins, and proteins involved in cell cycle regulation and miscellaneous proteins) and were included in a microarray along with β-actin and HPRT1 as endogenous proteins. The results for resistant cells to everolimus were normalized based on relative quantities observed in corresponding naïve cell populations, and are presented as heatmaps and volcano graphs. The criteria for significant overexpression were set at 5-fold increase in mRNA level and p < 0.05. See Supplementary Figure 1 for corresponding scatterplots.

