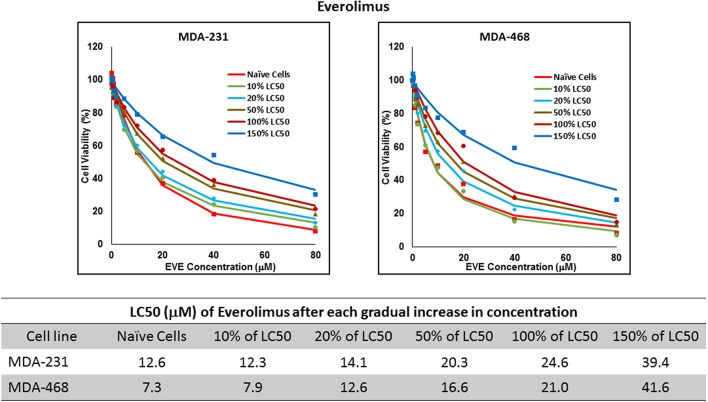
Figure 7.
LC50 of everolimus after multiple exposures to gradually increasing concentrations of the drug: All three selected cell lines were exposed to everolimus at gradually increasing concentrations (starting at 10% of the estimated LC50 value and up to 1.5 × LC50; at least three times for each concentration). The LC50 in corresponding cell lines was calculated with the similar method as for naïve cells, and the values are summarized in the table. We were unable to collect AU565 cells after the third exposure to 10% of estimated LC50 value for everolimus.

