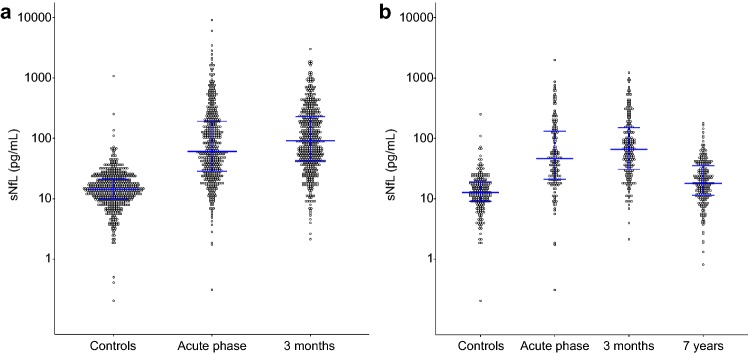
Fig. 2.
sNfL concentrations in ischemic stroke cases at different time points post-stroke and in controls. a sNfL concentrations in cases in the acute phase and at 3 months and in controls. b sNfL concentrations for the different time points for cases participating in the substudy on long-term outcomes (n = 221) and the matched controls (n = 221). Horizontal lines represent median concentrations and interquartile ranges. sNfL serum neurofilament light chain

