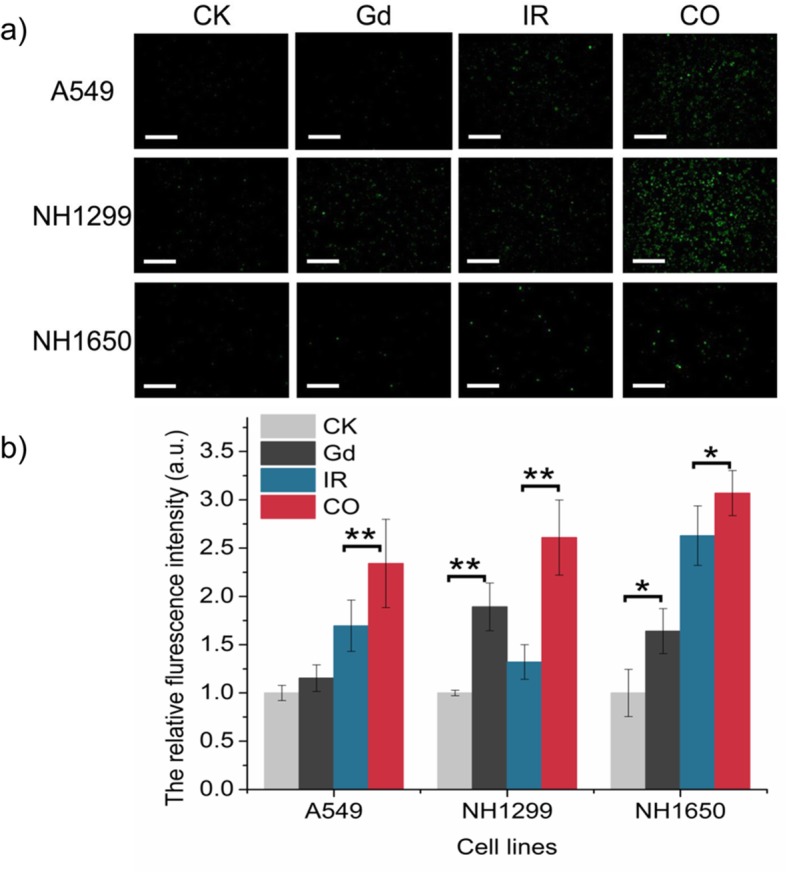
Fig. 3.

GONs promoted ROS production. a The fluorescence images of ROS production observed after radiation by DCFH-DA, “CO” means the cotreatment with GONs and carbon ion radiation; scale bar represents 200 μm. b The relative fluorescence intensity of cells with or without GONs was analyzed using ImageJ software. *p < 0.05 or **p < 0.01 represent statistically significant or extremely significant differences, respectively
