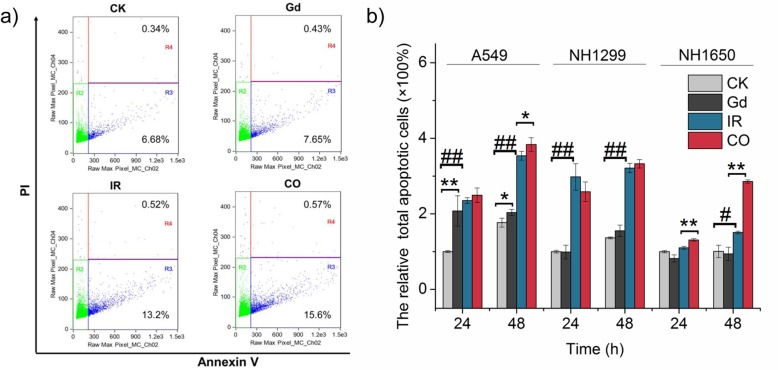
Fig. 5.
Marked apoptosis was induced by GONs in A549 and NH1650 cells but not in NH1299 cells. a The flow cytometry images indicating the apoptotic rates of A549 cells at 48 h after carbon ion radiation. b The relative incidence of apoptosis induced by GONs treatment and irradiation. *p < 0.05 or **p < 0.01 represent statistically significant or extremely significant differences, respectively, induced by GONs. Similarly, #p < 0.05 or ##p < 0.01 indicated significant or extremely significant differences, respectively, owing to radiation

