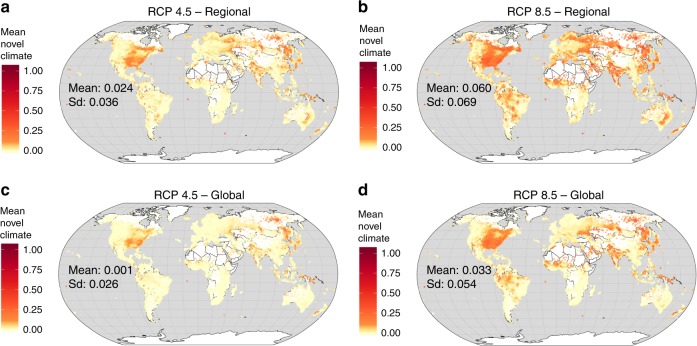
Fig. 4.
Regional- and global-scale novel climate index of terrestrial protected areas worldwide. The regional-scale novel climate index shows the proportion of raster cells inside a PA that hold climate classes in the future which are currently not present in the entire PA network of the respective biome. The global-scale novel climate index indicates the proportion of raster cells inside a PA that hold climate classes in the future which are currently not present in the global PA network. The mean of the novel climate indices comprise future climate data from ten GCMs under RCP 4.5 and 8.5. a Mean of the regional, biome-specific novel climate index under RCP 4.5. b Mean of the regional, biome-specific novel climate index under RCP 8.5. c Mean of the global-scale novel climate index under RCP 4.5. d Mean of the global-scale novel climate index under RCP 8.5. For each metric in a–d the mean across all 137,432 PA values are also given inside the global maps. Data on climate change metrics and other characteristics per PA are given as Supplementary Data 1. The maps were created using open-source software R52

