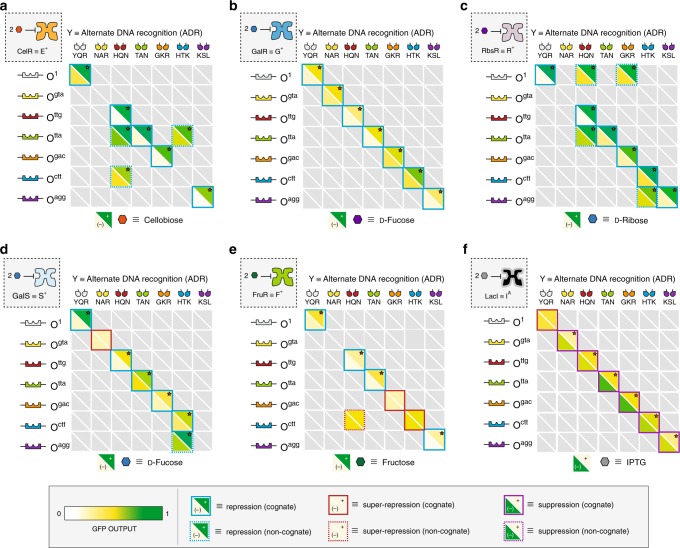
Fig. 2.
Repression matrices for the regulatory core domains equipped with ADR units. a Cellobiose Repressor, CelR ≡ E, b Galactose Repressor, GalR ≡ G, c Ribose Repressor, RbsR ≡ R, d Galactose Isorepressor, GalS ≡ S, e Fructose Repressor, FruR ≡ F and f a representative antilac IA(1). The ADR DNA-binding domains are displayed along the top of the table and their corresponding operators are shown along the left. The bottom left triangle shows (OD600 normalized) GFP output in the absence of inducer, while the top right shows GFP output in the presence of 10 mM of the inducer corresponding to a given RCD. Red stars denote a statistically significant difference between the two states at α = 0.001 level using a one-tailed Student’s t-test. Values correspond to the mean of n = 12 biological replicates. Scale bar reference for GFP output are all scaled to the same absolute values (inset, bottom). Phenotype is denoted by the color of bounding box in accordance with Fig. 1. TF-operator pairs along the diagonal are classified as interactions between the ADR and a cognate operator (solid boxes). Dashed boxes indicates promiscuity in DNA recognition. Any repressor-operator combination that was incapable of repression (X- phenotype) is denoted in gray

