Figure 1.
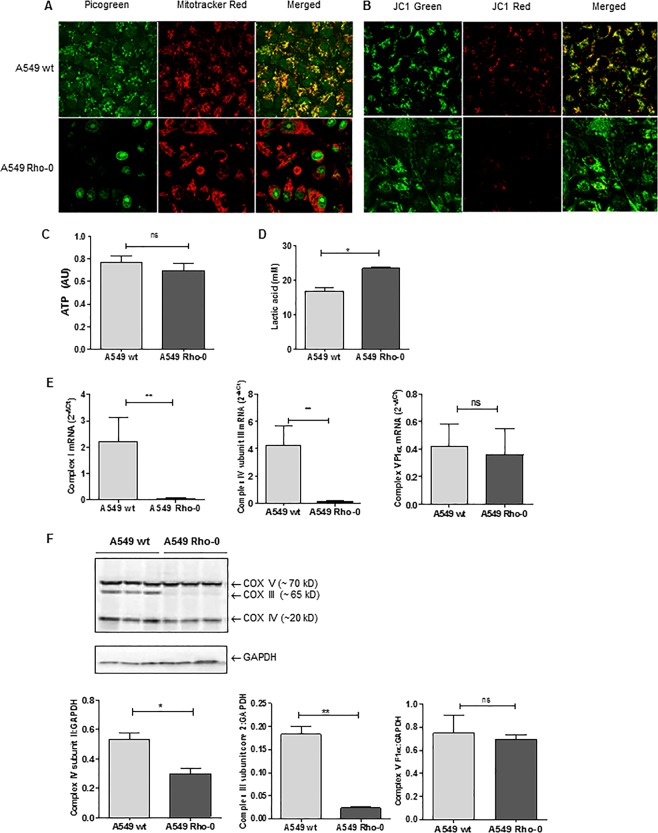
Mitochondrial (mt)DNA depletion and mitochondrial dysfunction in A549 Rho-0 cells. A549 wild-type (wt) and Rho-0 cells were grown to confluence and serum deprived for 24 hrs. (A) Cells were stained with Picogreen for detection of the DNA and Mitotracker DeepRed. Co-localization of DNA and mitochondrial bodies indicates mtDNA. Representatives of 3 independent experiments are shown. (B) Cells were stained with JC1 staining mitochondrial membrane potential is lowered by depletion of mtDNA in the A549 Rho-0 cells when compared to control cells. (C) ATP (mean ± SEM, n = 6–7) and (D) lactate (mean ± SEM, n = 3) were measured in cell-free culture supernatants. (E) RNA was isolated, cDNA synthesized, mRNA expression of NADH dehydrogenase (complex I), cytochrome c oxidase (complex IV) subunit III and ATPase subunit F1α (complex V) analyzed by qPCR and related to the expression of housekeeping genes β2µG and PPIA. (F) Cell lysates were prepared and complex III, Complex IV and the ATPase subunit components were detected by western blotting, analysed by densitometry and related to GAPDH (mean ± SEM, n = 3). *p < 0.05 and **p < 0.01 between the indicated values as measured by the one-tailed Mann-Whitney test.

