Figure 1.
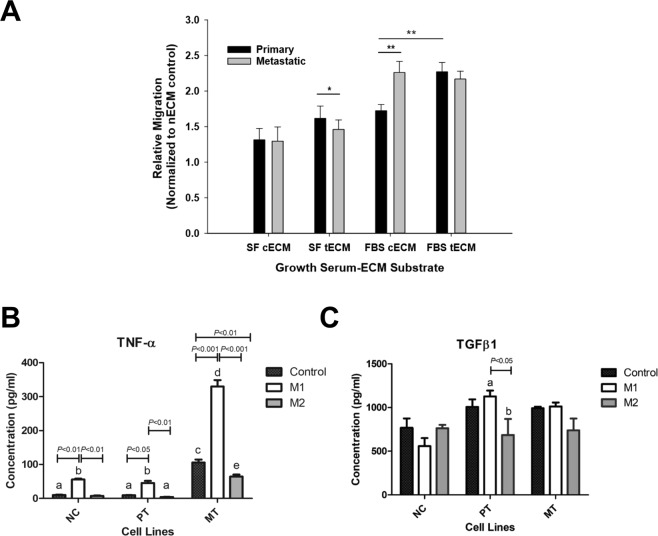
Transwell assays. (A) Relative migration of each tumor cell line on each ECM substrate, normalized to the respective “negative” control group of uncoated transwell membrane with no ECM (nECM) substrate coating. Five separate fields per slide were counted and averaged. Serum-free (SF) media controls were used to establish baseline migration with no chemoattractant in receiver well. Groups on the horizontal axis relate to growth conditions; within each group there is a representative bar for each cell line-ECM combination. Error bars represent the standard error of the mean, while horizontal bars highlight significant differences among pairwise comparisons. Primary tumor cells on transitional ECM (tECM) were included as a baseline for comparison, noting that they may not represent a biologically relevant case. Cells grown on FBS-supplemented control ECM substrate (“FBS cECM”) showed significant differences in relative migration between primary and metastatic cells (P < 0.001). Cells in serum-free tECM substrate (“SF tECM”) also showed significant differences in relative migration (P < 0.05). In supplemented media, relative migration of primary cells was shown to be different with respect to the ECM substrate (P < 0.001). (B) Macrophage-tumor cells indirect co-culture assay. TNF-α levels indicated a significant difference between the cases with M1-activated macrophages and the cases with naïve (“control”) or M2 macrophages (P ≤ 0.05). (C) Control transwells without tumor cells in the insert showed no differences in TGFβ1 levels across the treatment groups. NC: No tumor cells present; PT: with primary tumor cells; MT: with metastatic tumor cells.

