Figure 5.
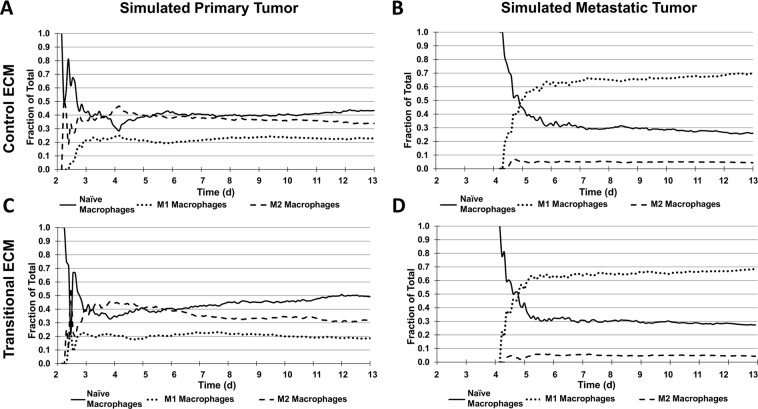
Simulated macrophage population fractions. Time evolution of macrophage subtype populations for (A) primary tumor on control ECM, (B) metastatic tumor on control ECM, (C) primary tumor on transitional ECM, and (D) metastatic tumor on transitional ECM. Primary tumor simulations of either ECM construct exhibited more balanced proportion of M1:M2 macrophage subtypes than metastatic tumors; on either ECM construct, M2 macrophages were more prominent than M1 for primary tumors. In contrast, M1 macrophages dominated for the metastatic tumors.

