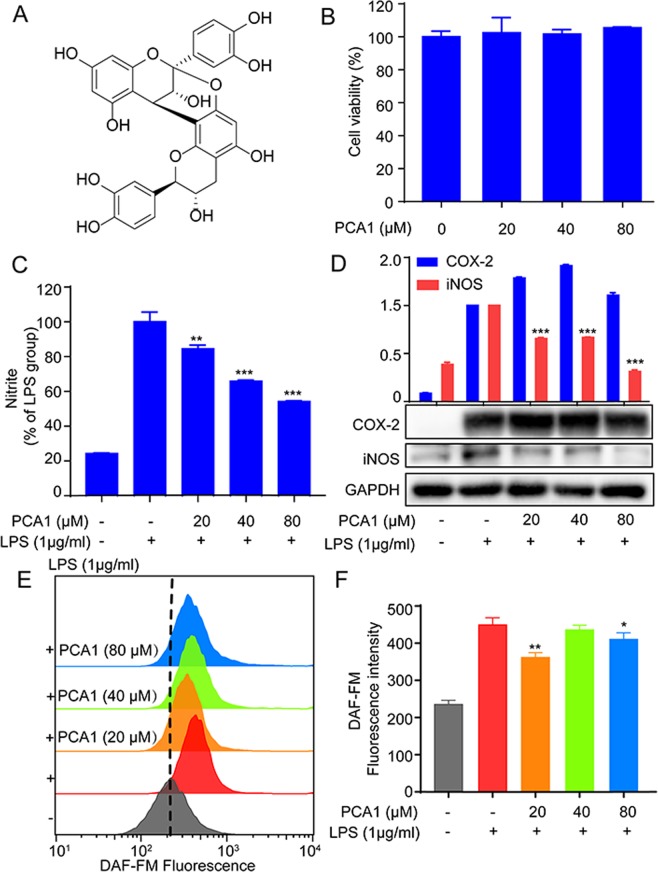
Figure 1.
PCA1 diminished LPS-stimulated inflammatory response in RAW264.7 cells. (A) Chemical structures of Procyanidin A1 (PCA1). (B) The cytotoxicity of PCA1 in RAW264.7 cells was determined by MTT assay after 24 h treatment. (C) RAW264.7 cells treated with PCA1 (20, 40, 80 μM) for 1 h and then induced with LPS (1 μg/ml) for 18 h. The medium was collected to determine the nitrite level using Griess Regent. (D) RAW264.7 cells treated with PCA1 (20, 40, 80 μM) for 1 h and then induced with LPS (1 μg/ml) for 18 h. iNOS and COX-2 expressions were detected by Western blotting. The grouping of gels/blots cropped from different parts of the same gel (targets vs loading control). The full blots are shown in Supplementary Information. (E) RAW264.7 cells were the treatment of PCA1 (20, 40, 80 μM) for 2 h before the co-treatment of LPS (1 μg/ml) for 6 h. Then the cells were marked with DAF-FM for 1 h, which were assessed by flow cytometry. (F) Statistical analysis of the NO per group. **p < 0.01, and ***p < 0.001 versus the LPS induced group.

