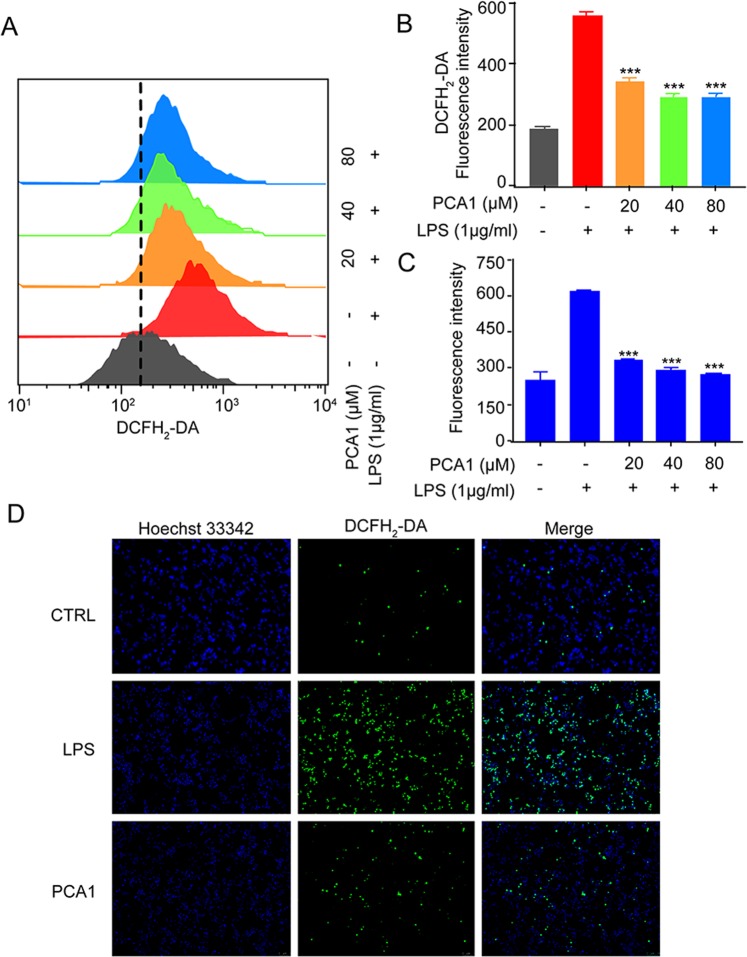
Figure 5.
PCA1 inhibited ROS generation. (A) RAW264.7 cells treated with for PCA1 (20, 40, 80 μM) for 1 h were incubated with LPS for 8 h. Cells were stained with DCFH2-DA (1 μM) for 30 min. The fluorescence intensity was determined by flow cytometry at the FITC channel. (B) Statistical analysis of the ROS per group. (C) RAW264.7 cells were seeded into 96-well plates and cultured overnight. Cells pretreated with PCA1 (0, 20, 40, 80 μM) for 1 h were stimulated with LPS (1 μg/ml) for 8 h. The ROS level was determined by a ROS kit (Sigma MAK143) according to the manufacturer’s instructions. (D) ROS level in cells was stained with DCFH2-DA. The images were captured by fluorescence microscopy. ***p < 0.001 versus the LPS group.

