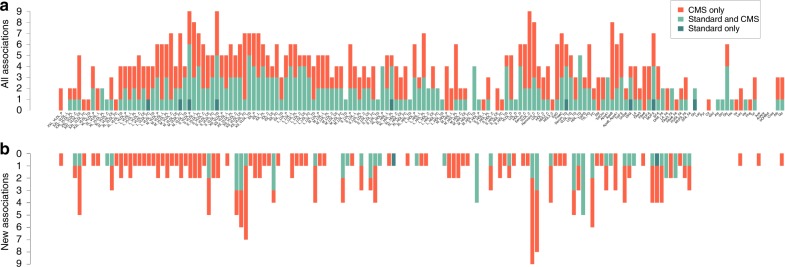
Fig. 1.
Region-metabolite associations. Distribution of the 588 significant associations (P < 1.28 × 10⁻⁹) identified in the 158 metabolites GWAS in the METSIM cohort. a Regions in dark green were significant for standard linear regression adjusted by confounding factors. Regions in red were significant for linear regression adjusted with confounding factors and covariates selected by CMS. Regions in light green were significant for both models. b Same plot including only the 228 new associations, not identified in previous metabolites GWAS

