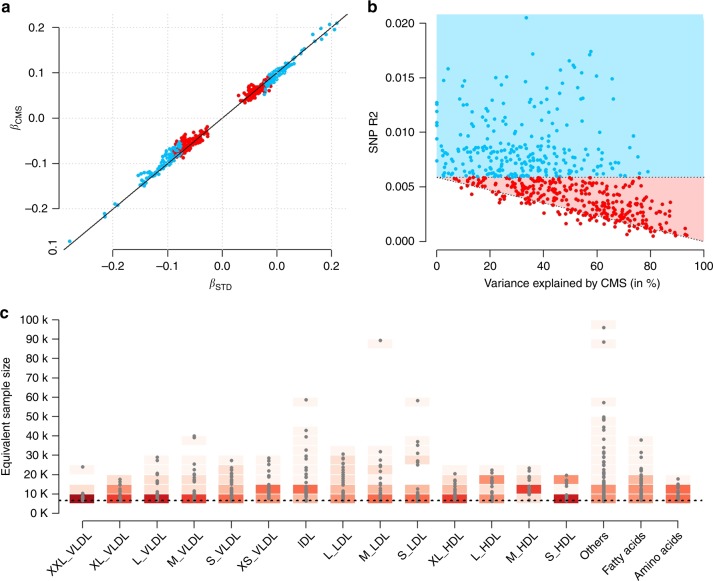
Fig. 2.
Overview of CMS results. Characterization of results from the CMS adjusted analysis among the 588 identified region-metabolite associations. For all panels, we used the most associated SNP per region. a The regression coefficient for each SNP estimated using standard linear regression (βSTD) and after adjustment for the covariates selected by CMS (βCMS). Associations significant at 1.28 × 10⁻⁹ with the standard test are indicated in blue, those only significant with CMS are indicated in red. b The outcome variance explained by the SNPs as a function of the variance explained by covariates selected by CMS for the corresponding associations. The blue and red areas correspond to the detectable SNP effect size for simple regression given the available sample size, and after explaining the residual outcome variance, respectively. c The gain in power achieved by CMS across the species analyzed, expressed as equivalent increase in sample size. The dash black line corresponds to the baseline sample size of 6623 individuals. The gradient of reds indicates the density

