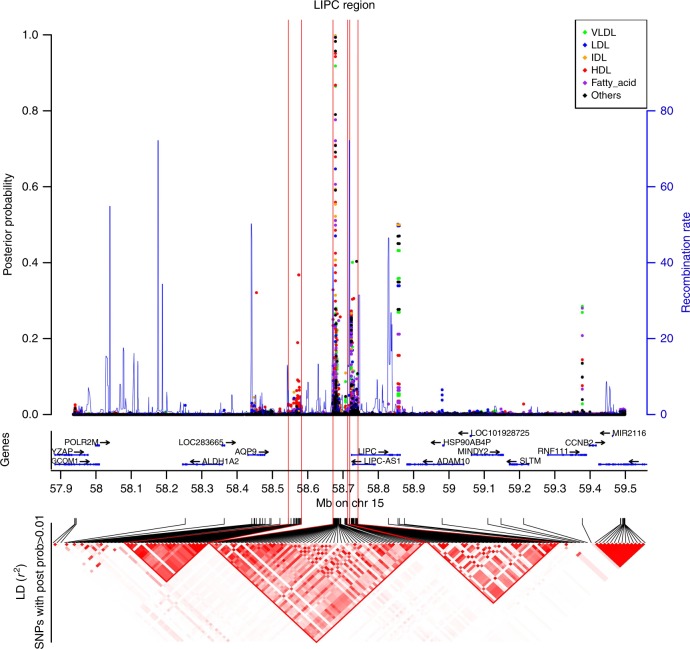
Fig. 5.
Fine mapping of the LIPC region. The top panel indicates the posterior probability assessing the evidence that the SNP is causal for each of the 75 phenotypes and the local recombination rate. The middle panel contains genes from the UCSC hg19 annotation. The lower panel is a r²-based LD heatmap computed using PLINK1.9 on the METSIM data. The gradient of red is proportional to the r². For clarity, we represented the LD only for SNPs with a posterior probability > 0.01 for at least 1 phenotype

