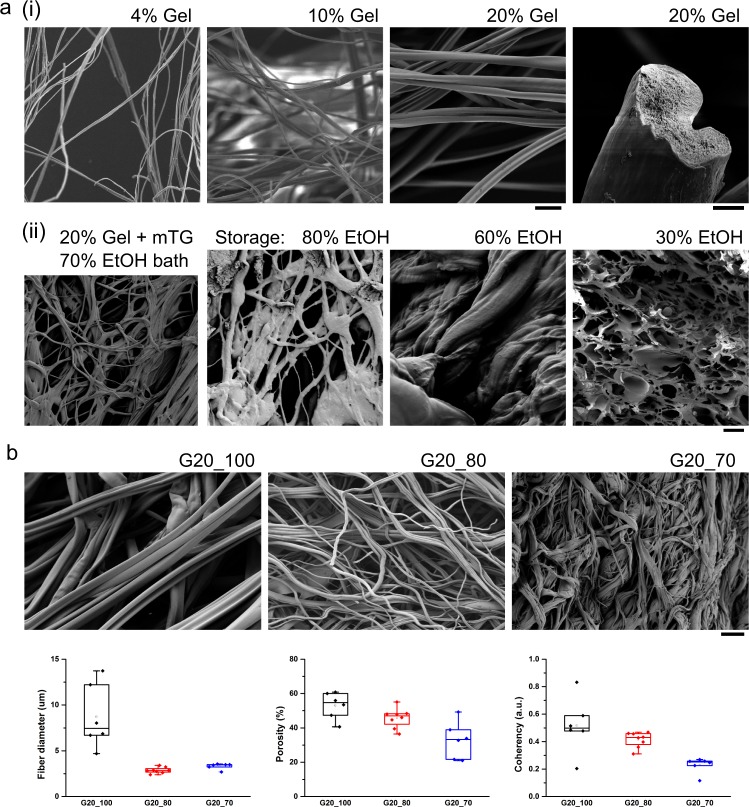
Fig. 2.
Gelatin fiber morphology and analysis using scanning electron microscopy (SEM). a Fibrous gelatin scaffolds (i) produced using three different gelatin concentrations (4%, 10%, and 20% w/w gelatin in DI H2O) spun into a pure ethanol (EtOH) precipitation bath; scale bars are 20 μm (left panels) and 2 μm (right panel); (ii) scaffolds produced by co-spinning 20% gelatin and a microbial crosslinking agent into 70:30 EtOH:H2O bath, with subsequent storage in EtOH:H2O at indicated concentrations (EtOH:H2O, from left to right: 100:0, 80:20, 60:40, 30:70); scale bar is 20 μm. b Gelatin fibers produced using 20% gelatin spun into EtOH:H2O precipitation bath at indicated concentrations (EtOH:H2O, from left to right: 100:0, 80:20, 70:30); scale bar is 50 μm. Data plots for fiber diameter, scaffold porosity, and scaffold coherency (alignment) are N = 3 productions runs for each bath composition. Coherency depicts alignment ranging from 0 (no alignment) to 1 (perfect alignment). Data are presented as box plots, where lower or upper edges of the box represent 25th or 75th percentiles, the middle bar is the median, and whiskers are 5th or 95th percentiles

