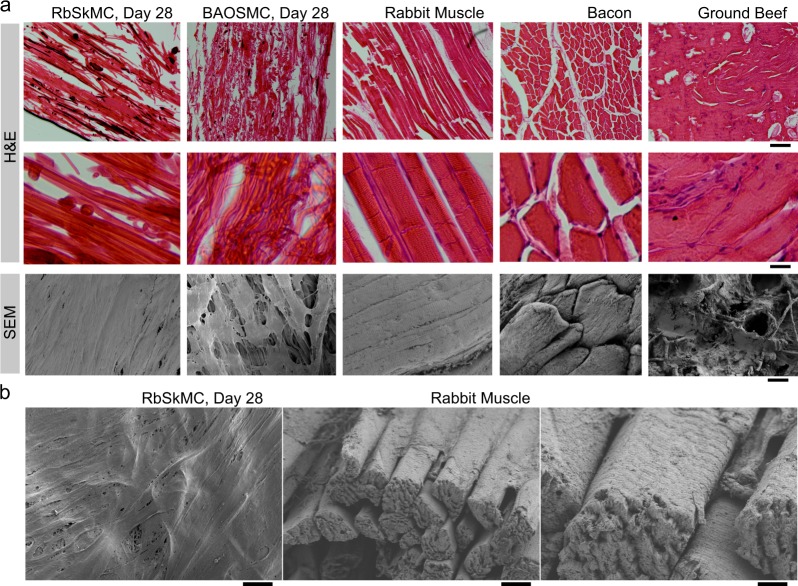
Fig. 7.
Microstructural comparison of cultured tissues and food products. a Hematoxylin and eosin (H&E) stains (top two rows) and scanning electron microscopy (SEM) of rabbit skeletal muscle myoblast (RbSkMC)- and bovine aortic smooth muscle (BAOSMC)-cultured tissues (both Day 28), compared with natural rabbit muscle (freshly isolated gracilis muscle from hind limb), bacon, and ground beef. Scale bars are 200 μm (top row), 50 μm (middle row), and 20 μm (bottom row). b SEM images comparing cultured RbSkMC tissue (left panel, scale bar is 10 μm) with skeletal muscle tissue isolated from uncooked rabbit hind limb (right panel, gracilis muscle, scale bar is 10 μm, inset scale bar is 2 μm)

