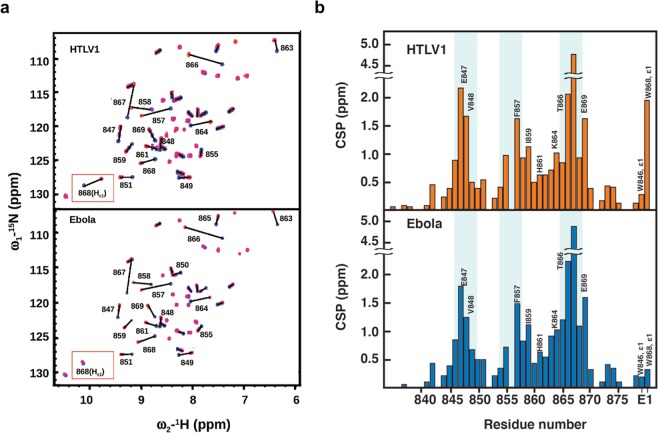
Figure 2.
NMR titration of Ebola and HLTV1 Late domains onto the hNEDD4-WW3 domain. (a) Superposition of four 1H-15N-HSQC spectra of hNEDD4-WW3 domain at different protein/ligand ratios. Upper panel shows spectra obtained at 1:0.0 (blue), 1:0.5 (purple), 1:1.5 (pink) and 1:3.0 (orange) molar ratios for the HTLV1 complex. Lower panel shows spectra at 1:0.0 (blue), 1:1.0 (purple), 1:2.5 (pink) and 1:10.0 (orange) molar ratios for the Ebola complex. The signal of the indole proton of W868, which shows a differential behavior in the two complexes, has been highlighted in a red box. (b) Average Chemical Shift Perturbations (CSPs) calculated at the last titration point for each residue in the 1H-15N-HSQC spectra of NEDD4-WW3 domain in the presence of 1:3 excess HTLV1 peptide (upper panel) and 1:10 excess Ebola peptide (lower panel). The experimental error for the spectral resolution is estimated to be ±0.03 ppm (see Methods for details).

