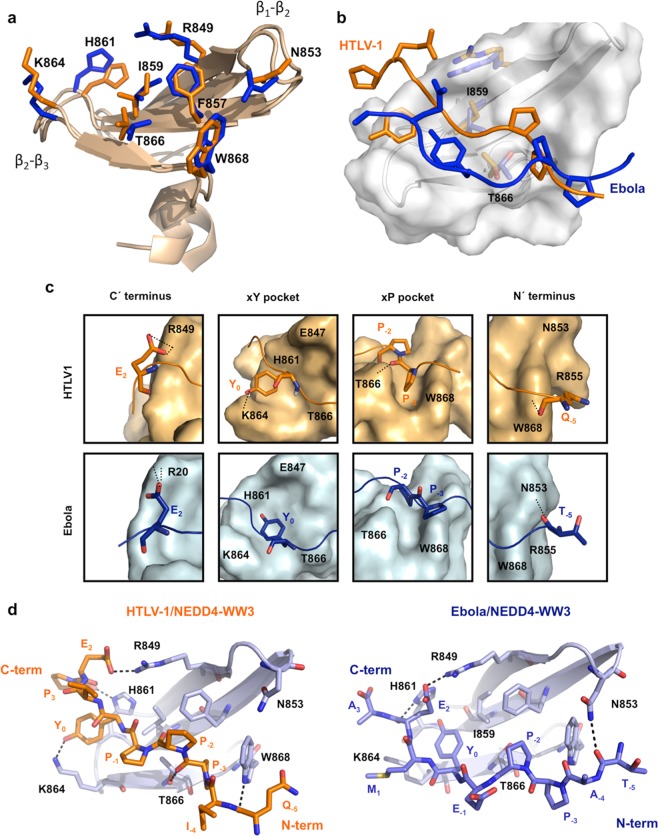
Figure 3.
Structural comparison of the Ebola and HTLV1 complexes with hNEDD4-WW3. (a) Structural superposition of the hNEDD4-WW3 domain structure (light brown cartoons) from the Ebola and HTLV1 complexes. Shown are the lowest energy models in the NMR ensembles. The side chains of the WW domain residues involved in binding are shown as orange (HTLV1) and blue (Ebola) sticks. (b) Orientation of the Ebola (blue) and HTLV1 (orange) ligands on the hNEDD4-WW3 binding site. Residues I859 and T866, determining the size of the xP and xY pockets in these complexes and defining ligand orientation are shown as blue (Ebola) and yellow (HTLV) sticks. (c) Detail of the interactions established by the HTLV1 (upper panels) and Ebola (lower panels) ligands at the different regions on the hNEDD4-WW3 binding site. (d) Intermolecular hydrogen bonds established between the HTLV1 (left panel) and the Ebola (right panel) Late domain peptides and the hNEDD4-WW3 domain. The WW domain is shown in a light blue cartoon representation. The most relevant side chains for ligand recognition are shown in light blue sticks. Ligand atoms are shown as orange (HTLV1) and dark blue (Ebola) sticks. Hydrogen bonds are depicted as discontinuous black lines.

