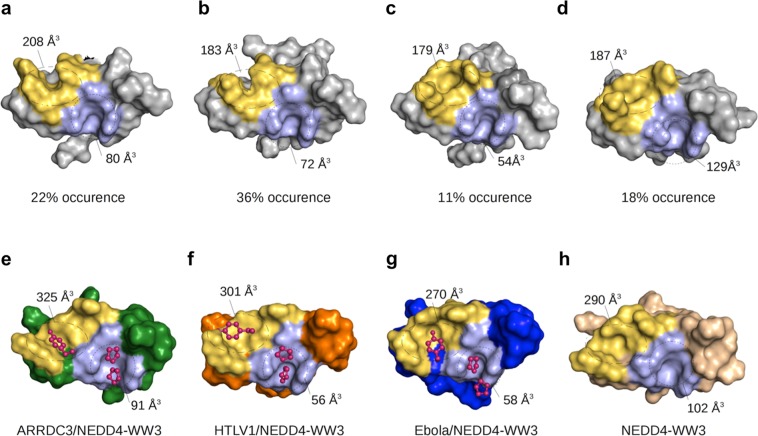
Figure 4.
Variability in hNEDD4-WW3 binding site geometry. Uppers panels (a–d) show the surface depiction of the representative structures from the four most populated clusters in the apo-NEDD4-WW3 domain simulation. Lower panels show the surface representation of the hNEDD4-WW3 domain from the crystal structure of the ARRDC3 complex (4N7H)28 (e), the lowest energy NMR models for the HTLV1 and Ebola complexes (this work 2KPZ and 2KQ0) (f,g) and the crystal structure of the apo NEDD4-WW3 domain (4N7F) (h). Residues in the xY pockets are colored in yellow, the xP pocket in light blue. Shown are the estimated sizes for the two pockets calculated with FPocket68.

