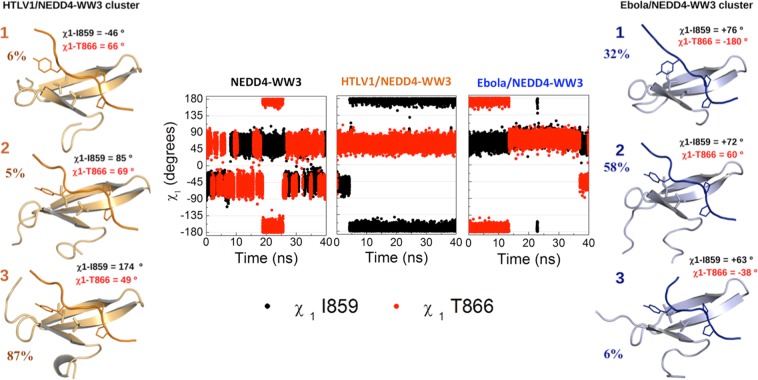
Figure 5.
Molecular dynamics study of hNEDD4-WW3 conformational plasticity. Modulation of the hNEDD4-WW3 conformational distribution upon ligand binding. The central panel shows the evolution throughout the trajectory of the I859 (black dots) and T866 (red dots) side chain dihedrals for the apo domain and the Ebola and HTLV1 complexes. Right and left panels show representative structures of the most populated clusters for the Ebola (blue) and HTLV1 (orange) simulations. Also shown are the respective frequencies of occurrence and the side chain dihedrals for the I859 and T866 residues.

