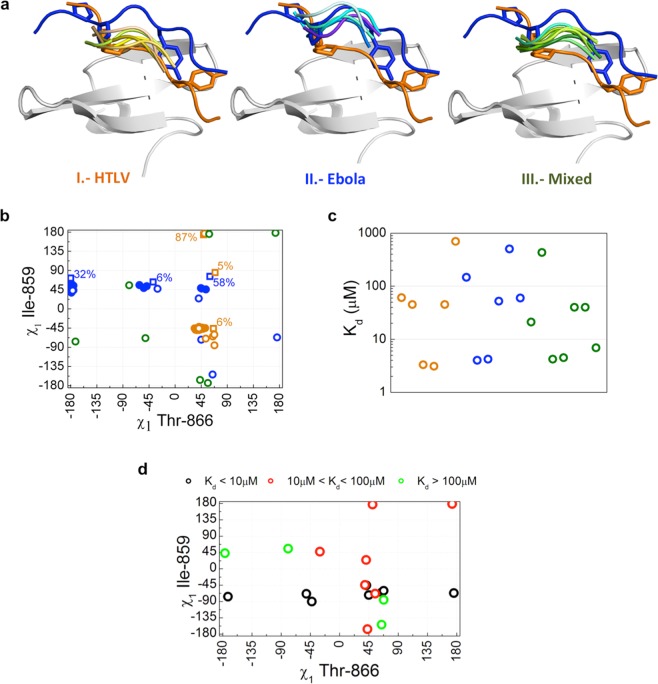
Figure 6.
Variability in ligand binding orientation for type I WW domains. (a) Cartoon representation of the hNEDD4-WW3 domain (light gray). The Ebola and HTLV1 ligands are shown as blue and orange ribbons, with the Y0 and P−2, P−3′ side chains shown as sticks. The PPxY core motif regions of the different ligands classified in each category are shown as ribbons. (b) Side chain dihedral angles for Ile858 and Thr866 in type I WW domains complexes. Open circles represent the side chain conformations observed in the high-resolution structures showing HTLV1-like (orange), Ebola-like (blue) or mixed (green) orientations. Following the same color code, full circles show the conformations adopted in the 20 lowest energy models from the Ebola and HTLV1 NMR ensembles, and open squares the most populated clusters identified in the molecular dynamics trajectories. Numbers indicate frequencies of occurrence. (c) Dissociation constants for the WW complexes in the structural database (see Supplementary Table S3) color coded by type of orientation: HTLV1-like (orange), Ebola-like (blue) and Mixed (green). (d) Side chain dihedral angles for Ile859 and Thr866 in type I WW domains complexes color coded according to binding affinity: Kd < 10 μM (black), 10 μM < Kd < 100 μM (red), and Kd > 100 μM (green).

