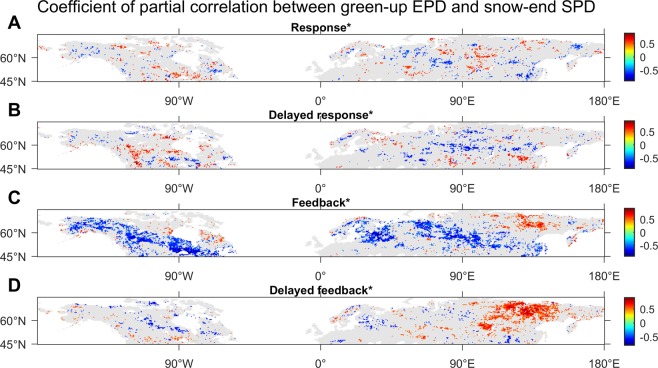
Figure 3.
Spatial distributions of the optimal coefficients of correlations, in the cases of probing into (A) response, (B) delayed response, (C) feedback, and (D) delayed feedback respectively, between the green-up EPDs and end SPDs over the Northern Hemisphere (>45°N) in the study period, all calculated at the significance level of p < 0.1 (indicated by *). The range of the derived correlation coefficients relating to the case of (A) response is from −0.90 to 0.89, the range of the derived correlation coefficients relating to the case of (B) delayed response is from −0.89 to 0.90, the range of the derived correlation coefficients relating to the case of (C) feedback is from −0.91 to 0.91, and the range of the derived correlation coefficients relating to the case of (D) delayed feedback is from −0.80 to 0.90.

