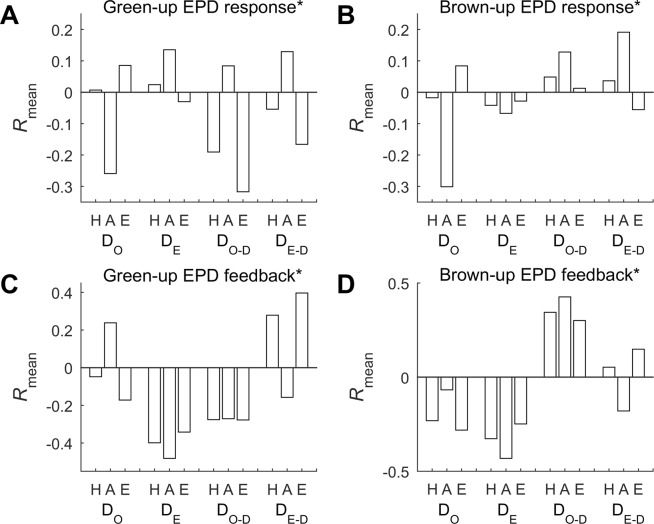
Figure 4.
Bars of the mean coefficients of the optimal correlations (Rmean) for characterizing the (A) green-up and (B) brown-up EPDs’ response and (C) green-up and (D) brown-up EPDs’ feedbacks to the onset and end SPDs in the within-the-same-OB-year and within-the-same-GE-year manner (DO and DE) or in the one-OB-year-delayed and one-GE-year-delayed manner (DO-D and DE-D, respectively), all calculated at the significance level of p < 0.1 (indicated by *), in terms of the NH (H), NA (A), and NE (E) as listed in the labels of the X axis.

