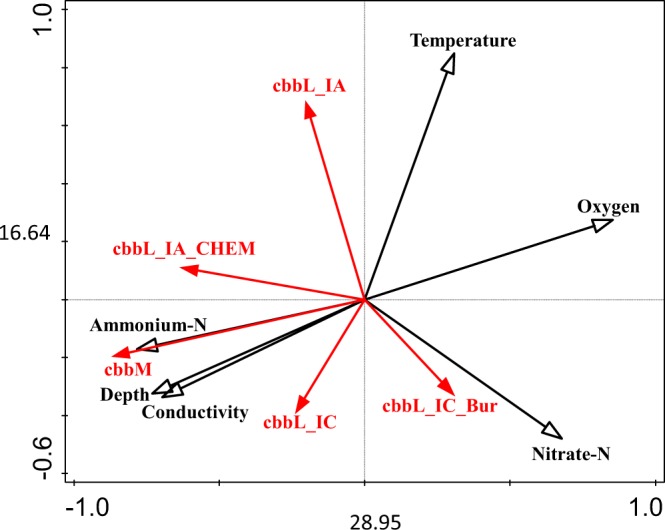
Figure 4.

Redundancy analysis biplot of the influence of selected environmental parameters (black arrows) on abundances of different RubisCO genes (cbbL_IA = RubisCO form IA; cbbL_IA_CHEM = RubisCO form IA in chemoautotrophs, cbbL_IC = RubisCO form IC; cbbL_IC_lake = RubisCO form IC in lakes; cbbM = RubisCO form II) obtained from water samples of Piburger See (shown in red, n = 108). Copy numbers of thaumarchaeal genes (hcd, amoA) were not analysed due to the low variability of the data close to the detection limit.
