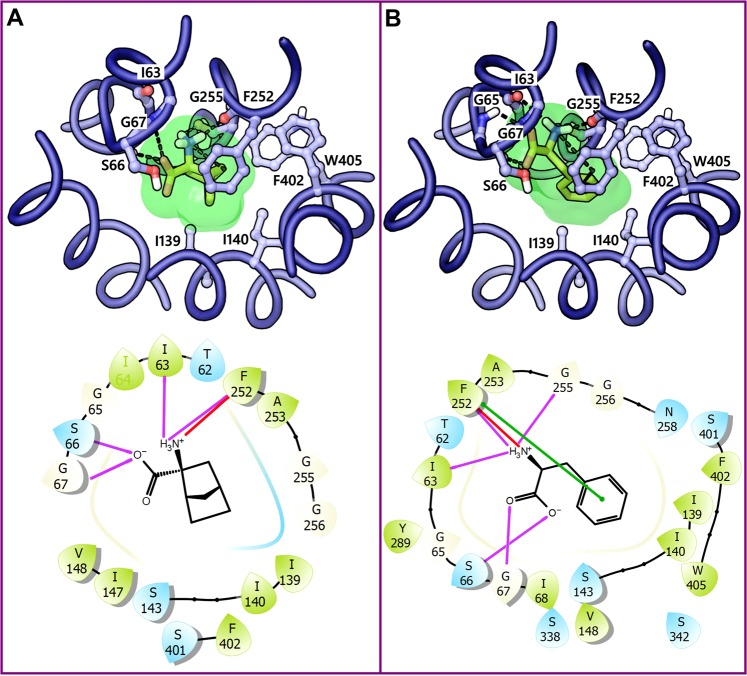
Figure 12.
QM-MM optimized poses and the corresponding 2D ligand interaction diagram of BCH (A) and L-phenylalanine 6 (B) to LAT1 (blue ribbon); the electron density (green) is mapped on to the surface of the ligand at the default isovalue of 0.001 electrons/bohr3. The ligand (yellow) and the residues (blue) in the docking poses are shown in stick and ball-stick representation, respectively. The protein-ligand contacts in 2D interaction maps are highlighted according to Fig. 8.

