
Figure 5.
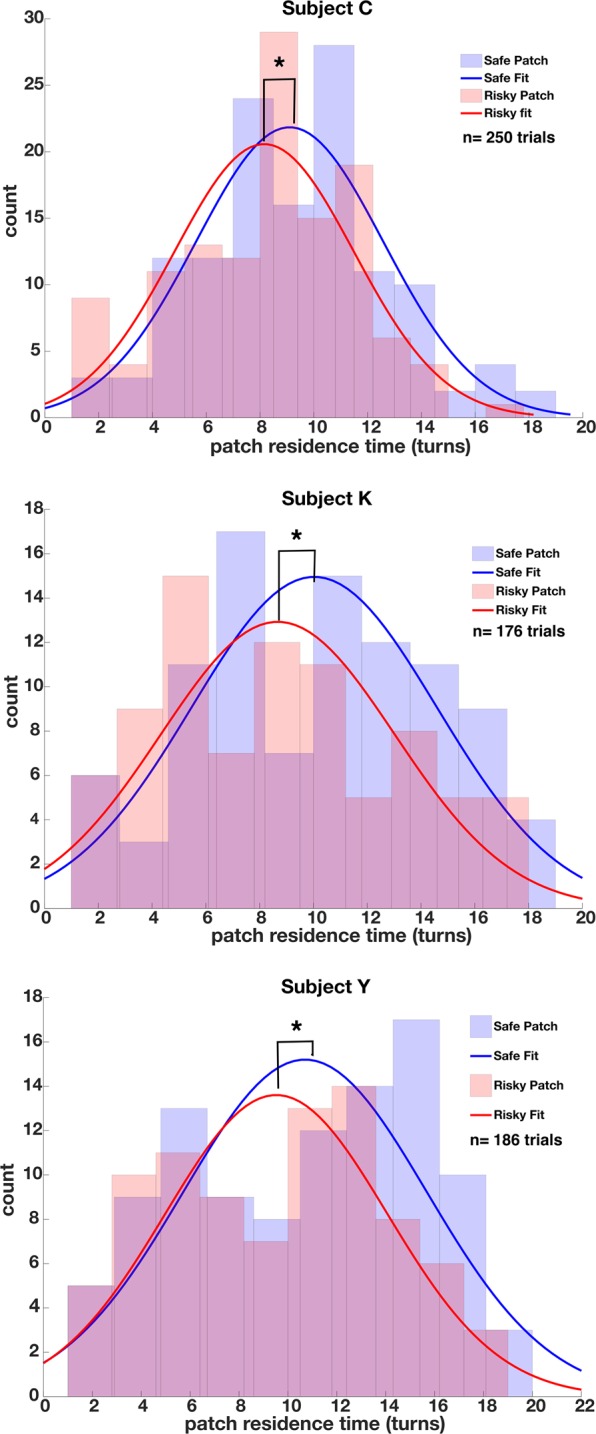
Histograms of recorded patch residence times for all subjects in safe (blue) and risky (red) patches for the standard environment condition. Residence time is indexed as the turn length or number of consecutive lever presses at a given patch before leaving (x-axis). The y-axis denotes the number of times a particular turn length occurred at the patch type. Solid lines indicate Gaussian fits to the observed leaving times. Patch residence times are significantly longer for safe than risky patches, indicating risk aversion.