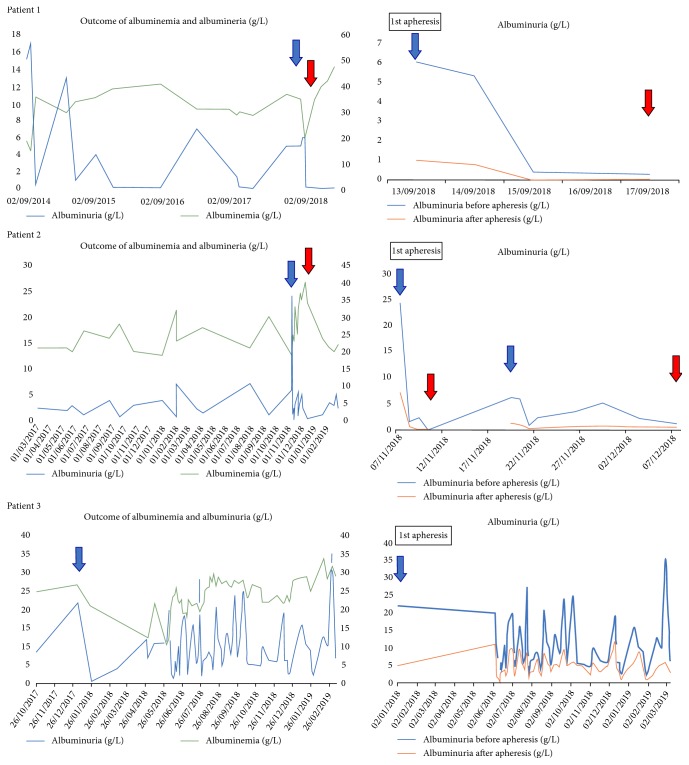
Figure 1.
Outcome of albuminemia and albuminuria (g/L) for three patients. The blue arrow corresponds to the beginning of apheresis therapy and the red arrow corresponds to the stop of apheresis therapy. On the x axis are dates of the sessions and y axis on the left side albuminuria (g/L) and on the right side albuminemia (g/L).

