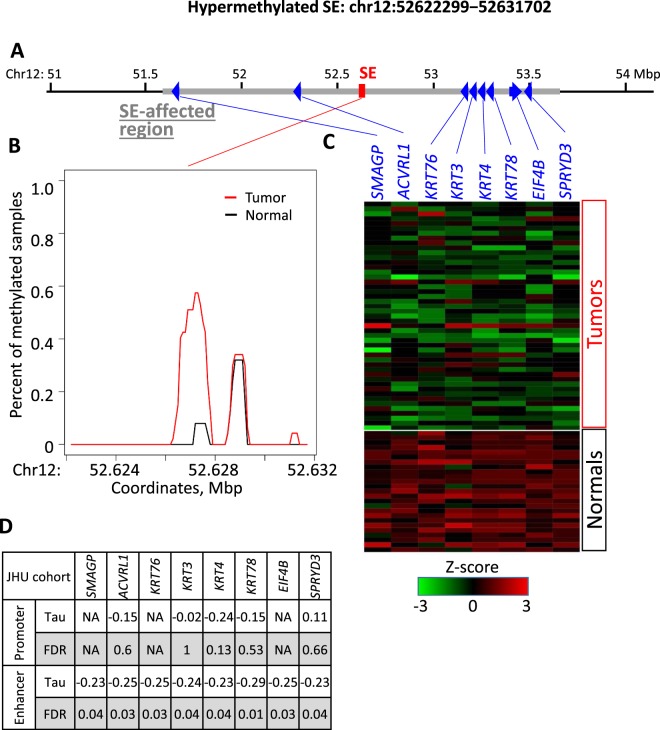
Figure 4.
Methylation and genetic landscape of the representative hypermethylated SE: chr12:52622299−52631702 in JHU cohort. (A) Genomic landscape of the SE region and potential target genes within one Mbp of the SE. (B) Relative average methylation coverage across the SE region (red – tumor, black – normal). (C) Log-transformed RNA expression of the potential target genes (z-score). (D) Kendall-tau values and corresponding FDR for correlation of promoter methylation with gene expression, as well as SE region methylation with gene expression of target genes.

