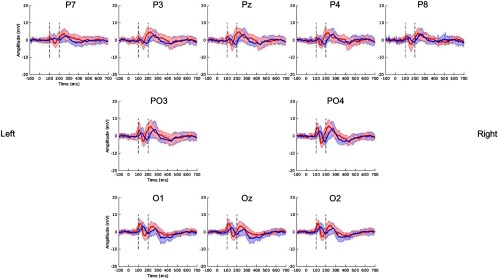
Fig. 5.
Event-triggered average ERP responses in 10 posterior electrodes, averaged across the 10 participants exhibiting the N170 response. Graphs are organized in the rows that the electrodes were positioned on the head (left and right sides are labeled). Black dashed lines mark 100 and 200 ms after stimulus presentation. Red represents faces and blue represents objects. Shaded regions show standard deviation.

