Figure 2.
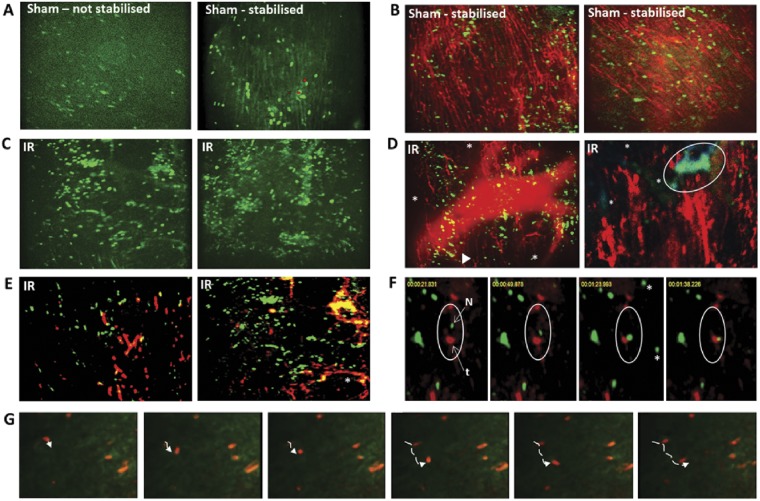
Neutrophils adherent within sham hearts do not prevent blood flow—platelet aggregates main contributors to occlusive events in IRI. (A) Blurry and out-of-focus intravital images obtained from ‘non-stabilized’ hearts, but still showing adherent neutrophils in sham myocardial microcirculation. Better quality and easily quantifiable intravital images obtained following stabilization, which confirm neutrophil adhesion in beating sham hearts. (B) Adherent neutrophils in sham hearts do not compromise blood flow as widespread FITC-BSA perfused capillaries are visible. Green, neutrophils (PE+anti-Gr-1ab); Red, FITC-BSA. (C) IRI increases neutrophil adhesion, most of which are singular, although aggregates also identified. (D) Blood flow compromised in IRI hearts as evidenced by not all capillaries being filled with FITC-BSA. This did not always correspond to areas of neutrophil adhesion. Some capillaries ‘finish’ abruptly (arrowhead; out-of-focus large vessel seen in this field of view). Magnified image (right) shows neutrophils often adherent or trapped within platelet microthrombi in injured hearts, as indicated by co-staining, to form large occlusive aggregates. These impact detrimentally on blood flow as indicated by inability of FITC-BSA (red) to perfuse into capillaries (*) downstream of microthrombus (blue/green—circle) comprised of platelets (blue) and neutrophils (green). (E) Neutrophil adhesion, platelet aggregation and microthrombus formation following IRI. Microthrombi occupy and follow the contours of a significant length of the capillary (*). Co-localization (yellow) indicates aggregates are often, but not always, comprised of both neutrophils and platelets. Green, neutrophils (PE+anti-Gr-1ab); Red, endogenous platelets (APC+anti-CD41ab). (F) Time-lapse images from an IRI beating heart video. From left to right, within the white circles, a single circulating neutrophil (green, N) is shown unable to move down the capillary as it is occluded by a downstream stationary platelet thrombus (red, t). *Circulating neutrophils seen in one frame but not the next. (G) Time lapse images from a sham beating heart showing a ‘patrolling’ neutrophil. Dotted lines—track movement of ‘patrolling’ neutrophil. Scale bars represent 100 μm.

