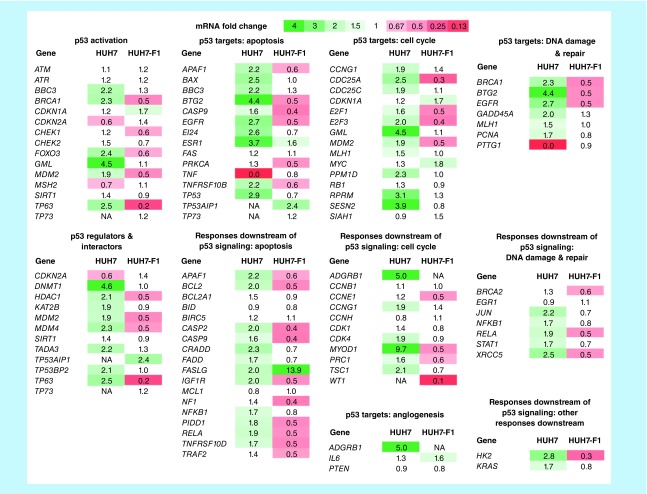
Figure 6. . Heatmap of mRNA fold changes in p53 signaling after treatment with 10 μM PK9318 for 9 h of HUH-7 and the isogenic HUH-7 p53 knockout cell line.
The qPCR array comprises 84 genes related to p53-mediated signal transduction, classified into subgroups. Changes in mRNA levels were calculated using the ΔΔCt method. A value of 1 indicates no change in relative transcript levels between control- and PK9318-treated samples (values between 0.66 and 1.5 are shown in white). Increased mRNA levels are shown in green, starting from 1.5 (light green) to 4 (dark green), and decreased mRNA levels are shown in red, ranging from 0.66 (light red) to 0 (dark red). For ADGRB1 in HUH-7 p53 KO cells and TP73, WT1 in HUH-7 cells, no reliable ΔΔCt values could be obtained (shown as NA). Especially p53-target genes that are involved in apoptotic signaling (e.g., PUMA [BBC3], BTG2, ESR1, EGFR) and cell cycle modulation (GML, MDM2, SESN2) were selectively upregulated in HUH-7 (p53-Y220C) cells after PK9318 treatment, indicating Y220C-dependent induction of apoptosis and cell-cycle arrest in this cell line.

