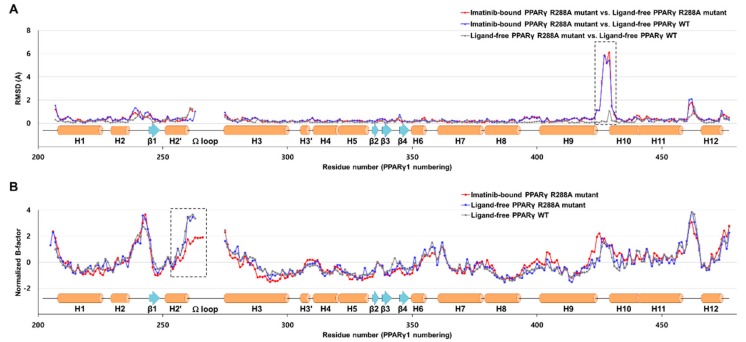
Figure 4.
Comparison of imatinib-bound PPARγ R288A mutant LBD, ligand-free PPARγ R288A mutant LBD, and ligand-free PPARγ wild-type (WT) LBD structures with respect to Cα RMSD and normalized B-factors. (A) Comparison of the Cα root-mean-square deviation (RMSD) values for the imatinib-bound PPARγ R288A mutant LBD structure against the ligand-free PPARγ R288A mutant LBD and ligand-free PPARγ WT LBD (PDB ID: 6JQ7) structures. Red and blue lines represent the RMSD values for imatinib-bound PPARγ R288A mutant LBD vs. ligand-free PPARγ R288A mutant LBD and imatinib-bound PPARγ R288A mutant LBD vs. ligand-free PPARγ WT LBD structures, respectively. Grey lines represent the Cα RMSD values for ligand-free PPARγ R288A mutant LBD vs. ligand-free PPARγ WT LBD structures. Secondary structural elements are represented along the residue numbers. The H9–H10 loop region between residues Asn424 and Leu431 exhibiting a large conformational change is marked by a black-dashed box. (B) Comparison of the normalized B-factors for imatinib-bound PPARγ R288A mutant LBD, ligand-free PPARγ R288A mutant LBD, and ligand-free PPARγ WT LBD structures. The normalized B-factors for imatinib-bound PPARγ R288A mutant LBD, ligand-free PPARγ R288A mutant LBD, and ligand-free PPARγ WT LBD structures are represented in red, blue, and grey lines, respectively. Helix H2′ and the Ω loop, which exhibited enhanced thermal stabilities in the imatinib-bound PPARγ R288A mutant LBD structure, is marked by a black-dashed box.

