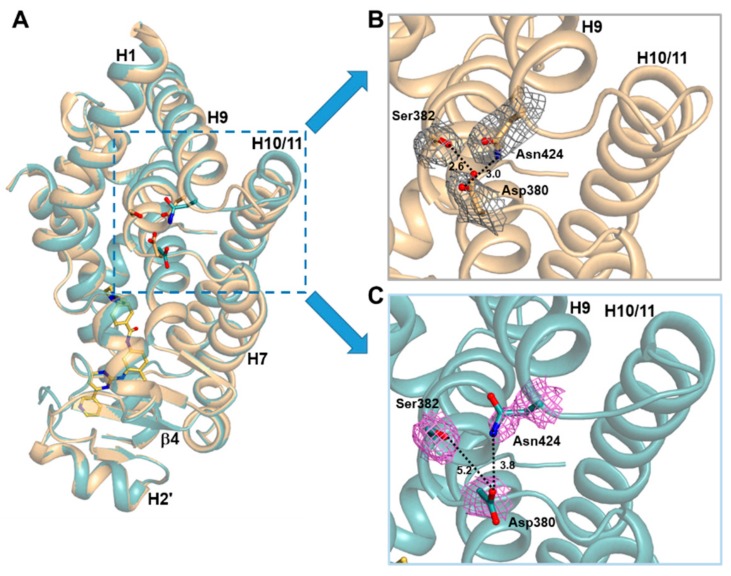
Figure 5.
Side views of imatinib-bound and ligand-free PPARγ R288A mutant LBD structures. (A) Superposition of ligand-free (light orange) and imatinib-bound (light teal) PPARγ R288A mutant LBD structures. The region with a large conformational change is represented by a cyan-dashed box. (B) A magnified ribbon diagram of the H9–H10 loop region in the ligand-free PPARγ R288A mutant LBD structure. The residues Asp380, Ser382, and Asn424 are shown in stick models with 2mFo–DFc electron density maps (in grey; contoured at 1.0σ). Dashed lines represent the distance between residues, and the corresponding distances (Å) are labeled. (C) A magnified ribbon diagram of the H9–H10 loop region in the imatinib-bound PPARγ R288A mutant LBD structure. The residues are represented in the same way as the ligand-free structure (A) with the violet-colored electron density maps.

